|
|
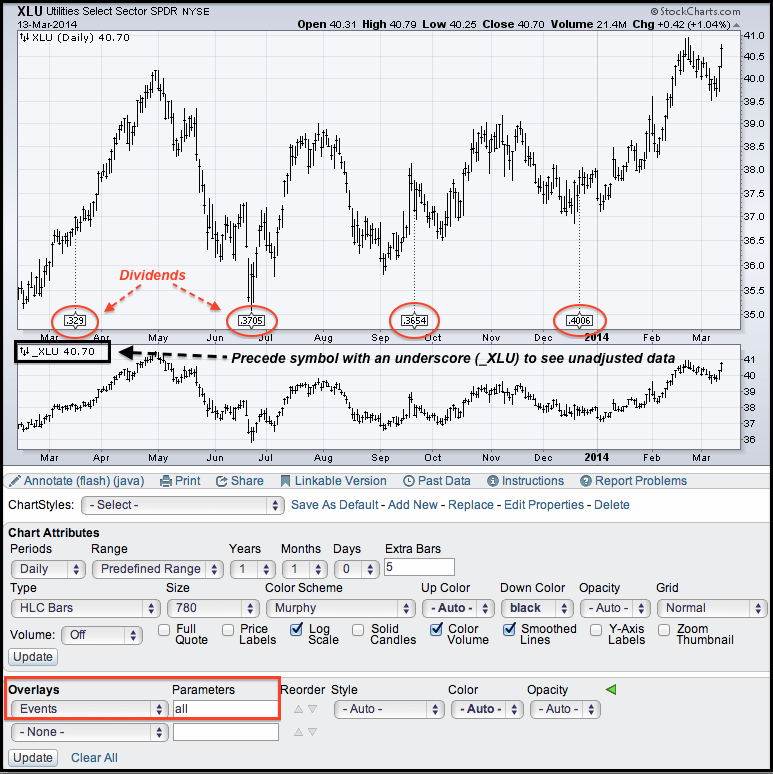
Chartists can view dividends and price adjustments by adding "events" as an indicator overlay. Enter "all" as a parameter and click update. The refreshed chart will show the dividend amounts with dotted lines marking the date. The chart for the Utilities SPDR (XLU) shows four dividends over the past year. The first dividend was in mid March 2013 so it looks like we will see another dividend soon. The lower window shows a chart for XLU with unadjusted data. Simply precede any symbol with an underscore (_XLU) to plot data that has not been adjusted for dividends. Unadjusted means the dividend amounts have not been added back into the price. Note that the default symbol (XLU) is dividend adjusted and this price plot represents the total return (price change plus dividends).
Click this image for a live chart


