|
|
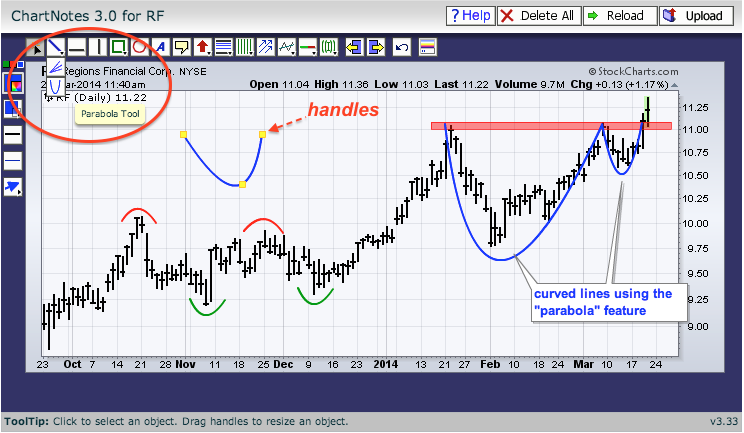
Chartists can draw curved lines by selecting the "parabola" feature in the ChartNotes workbench, which is used to annotate a SharpChart. A parabola is a symmetrical curve that forms two uniform halves when bisected. Curved lines are helpful for annotating double tops and bottoms, head-and-shoulder patterns, peaks, troughs and cup-with-handle patterns.
Chartists can access the "parabola tool" in the upper left corner of ChartNotes. First, click the annotation link on a SharpChart to open ChartNotes. Second, click the tiny triangle in the trend line icon to see the other icons (option). Third, click the "parabola tool" to select it. Fourth, move to your desired chart location and draw a curve. You can then resize this curve by dragging the handles (little yellow squares. The example above shows Regions Financial breaking rim resistance of a cup-with-handle pattern.


