|
|
Bound momentum indicators are best suited for overbought/oversold analysis. Basically, there are two types of momentum oscillators: bound and unbound. Bound oscillators, such as RSI and the Stochastic Oscillator, fluctuate within a specific range, zero to one hundred in this case. Unbound oscillators, such as MACD and Rate-of-Change, do not have upper and lower limits. This makes them relatively difficult to use for overbought/oversold analysis.
Click this image for a live chart
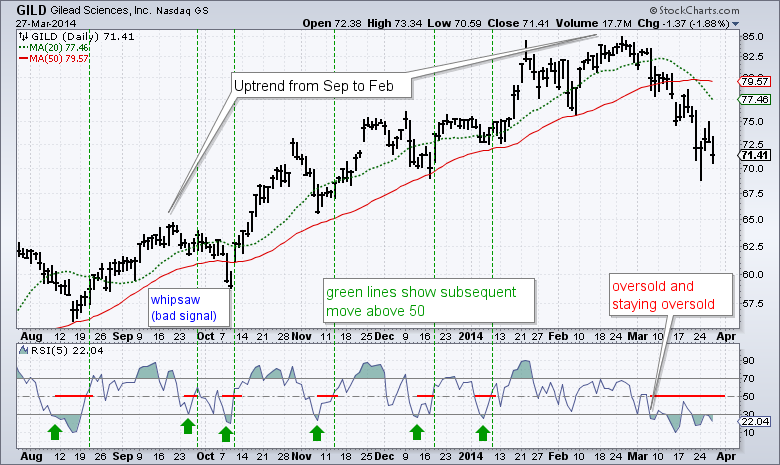
The example above shows Gilead (GILD) with 5-period RSI in the first indicator window. I am using 5-period RSI instead of 14-period RSI because the shorter timeframe makes it more sensitive and it generates more signals. RSI is deemed overbought when above 70 and oversold when below 30.
Chartists should keep two things in mind when looking for signals. First, identify the trend. Notice that the trend was up from September to February and there were far more overbought readings than oversold readings. Selling on overbought readings would have been a losing strategy. It is best to focus on oversold readings during an uptrend and overbought readings during a downtrend.
Second, wait for a signal that the pullback has ended. An oversold reading occurs during a pullback, but pullbacks sometimes extend further than expected. The early March oversold reading is a case-in-point. Chartists, therefore, should look for some sign that the pullback is ending and the bigger trend is resuming. An RSI move above 50 is one such trigger (green dotted lines).


