
|
Chartists can quickly and easily create performance charts by entering up to six comma-separated symbols in any symbol entry box. There is a symbol entry box at the top of every webpage and above every SharpChart. The chart below shows one-year performance for six symbols over the past year. Note that QQQ is up around 26% and RSP is up around 20%. DIA is up only 11.38% and the laggard of the group.
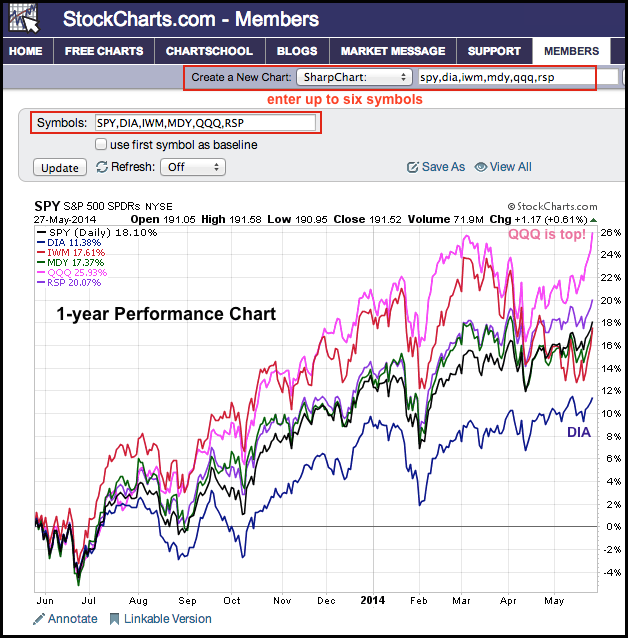
Click this image for a live chart
Chartists can also create a relative performance chart with just two mouse clicks. First, click the check box at the top to "use the first symbol as the baseline". Second, click the update button to refresh the chart. Users can also change the date range by using the drop down menu just under the SharpChart.
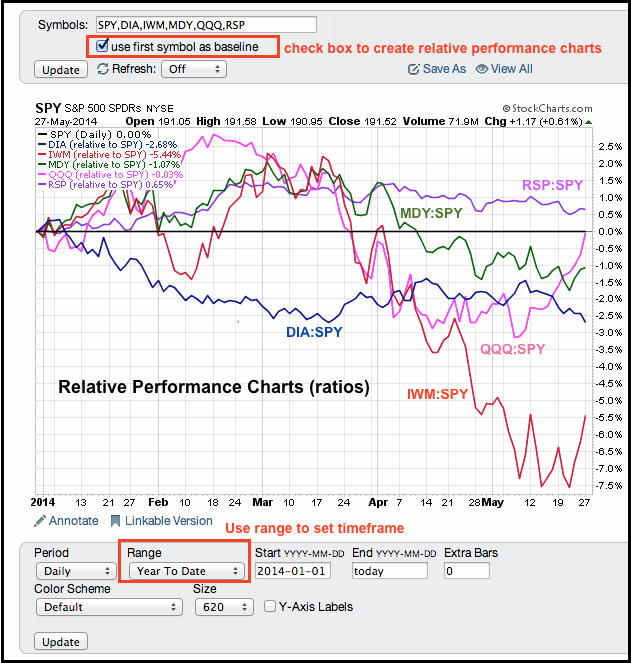
Click this image for a live chart
The example above shows year-to-date relative perforance for five major index ETFs. Each plot represents the performance of a ratio chart (e.g. DIA:SPY, IWM:SPY, MDY:SPY, QQQ:SPY, RSP:SPY). Year-to-date, the Equal-Weight S&P 500 ETF (RSP) is the strongest of the five and the Russell 2000 ETF (IWM) is the weakest. I am not including SPY because it is used as the benchmark.

Posted by: Kevin P June 17, 2014 at 22:07 PM
Posted by: Arthur Hill June 18, 2014 at 10:34 AM