
|
The Emerging Markets don't seem like they would be be great to me, but that is why we use charts. Looking at the Emerging Markets ETF (EEM), there is hope for the chart. It's definitely worth adding to the watchlist.
I was chatting with a friend who asked what I thought of the EEM. Whether it is a long or a short, that is the question! Let's check it out, with another indicator today.
First of all, the full quote box shows the SCTR at 57.9 which means it is outperforming 57.9% of the ETF's. That is just middle of the road performance. As you can also see, weekly liquidity (volume) is not a problem. Looking at the RSI, It has touched 30 recently on this weekly chart which marks a potential bear market. On December 31st, it touched 70 which we would use to indicate a bull market and by the end of February cycled down to 30 which cancels the bull signal and gives us a bear signal. So it is questionable as to which signal we are on, but for now the last piece of evidence is a bear market signal. The SPURS ($SPX Relative Strength) in purple is declining and has declined for almost 4 years. Recently it moved above the short term purple line, but is not making a significant move out of the major downtrend yet.
The SCTR has not been a top quartile performer for a year, and in the larger context, has not been above 75 for 3 years with a brief exception in 2012. For the most part the SCTR has topped out at 60. What make it interesting this week is that we closed last week above 60 at almost 70, so maybe 'times-they-are-a-changing'.(50th Anniversary of Bob Dylans Classic this year ;).
Moving onto Price for EEM, you can see the support/resistance zone drawn in with a rectangle. We are at the top. There is another 50 cents above us, but we are in the friction zone for sure. I like the trend of rising lows over the last 3 years. However, we need higher highs to make it an uptrend. While on the price plot, notice the rise in volume from January 2013 to end-of-March 2014. Since then the volume seems to be weakening which is one of the reasons I am concerned that this stops around this level. The last 4 weeks the volume is decidedly lower by 100 Million shares a week.
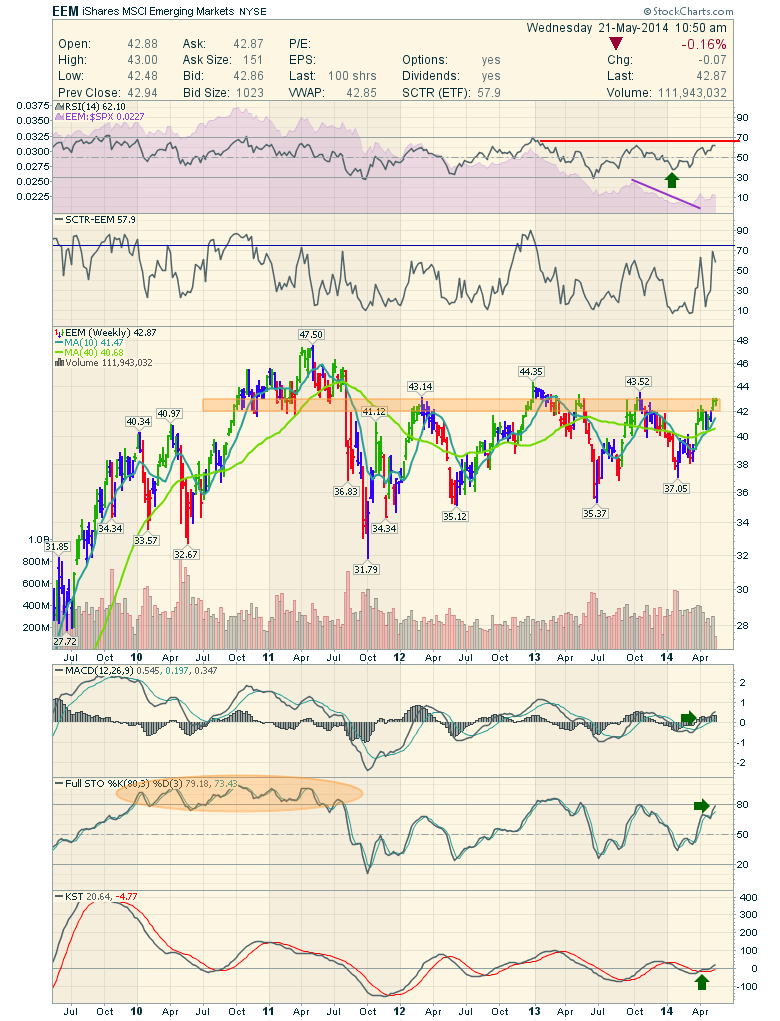
Moving on the MACD, it has just made a higher low and is starting to move higher above zero. However there is no positive divergence on this move which would be a better indication. Because it has oscillated so close to zero lately, I am less enamored with it until a breakout is confirmed. The Full Stochastics (80,3,3) have me more excited as it tests the 80 level. If this could finally push through above 80 and break out in price, that is a pretty strong signal to behold. The Sto's also have rising lows and are spending more time above the bullish 50 line. Promising, but we are not there yet.
I have included the KST on this chart so that we can get a multi time frame view of the cycles for EEM. At this time, it has recently crossed above zero and above the signal line. That is bullish too. Like the MACD, we would prefer to see positive divergence accompanying the signal as well. Here is a link to the Chartschool Article on KST.
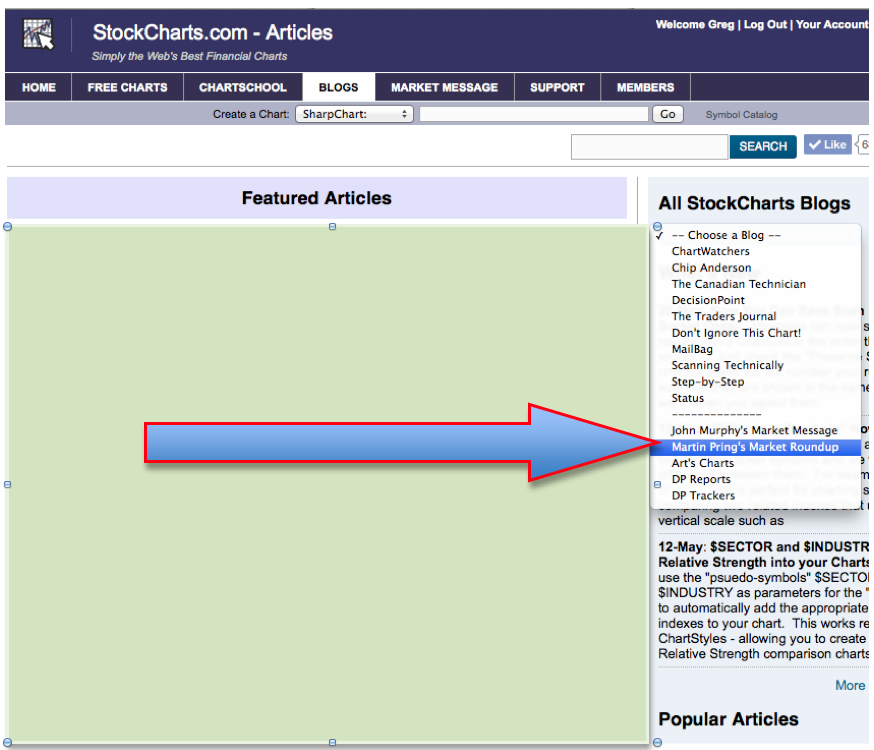
Now that Martin Pring has his own blog, that is a must read for subscribers. To get to it, head to the Blogs tab.
With that, I would say I am more likely to wait than to enter EEM here. It was discussed about a 6 weeks ago in the market message. Now it seems time to watch closely. A failure to break out would be very concerning. A move to new highs with volume would be very bullish. I would like to see the Full sto's cross above 80 and the SCTR get above 75. I think it needs to get more of the 'weight-of-the-evidence' on our side.
If you liked this article, feel free to forward it to investing friends and family. The chart is printable. It should also be clickable so that you can go look at the settings.
We try to keep our articles informative and entertaining. Make sure you check out the other blog writer articles in Mailbag, Chartwatchers, Traders Journal, DecisonPoint, Don't Ignore This Chart, Chip Anderson, Scanning Technically, and The Canadian Technician. Subscribers have access to blog articles by Arthur Hill, John Murphy, Martin Pring as well as the DecisionPoint Tracker and DecisonPoint Reports by Carl Swenlin and Erin Heim.
Lastly, Chartcon 2014 in Seattle is rapidly booking up. My understanding is the hotel is close to 'Sold Out' and the early booking discount expires the end of May. Click here for more information on Chartcon 2014. It is an unbelievable lineup.
Good trading,
Greg Schnell, CMT

