
|
Chartists can draw filled shapes on a SharpChart with just a few easy mouse clicks. First, create a SharpChart and open the ChartNotes workbench by clicking the "annotate" link at the bottom. Second, hold down the CTRL key and drag out the desired shape. Chartists can choose the box, circle or square icons. Once drawn, you can change the fill mode and the opacity using the icons on the left. Fill mode can be solid, filled or no fill. All three options are shown with their relevant icon in the image below.
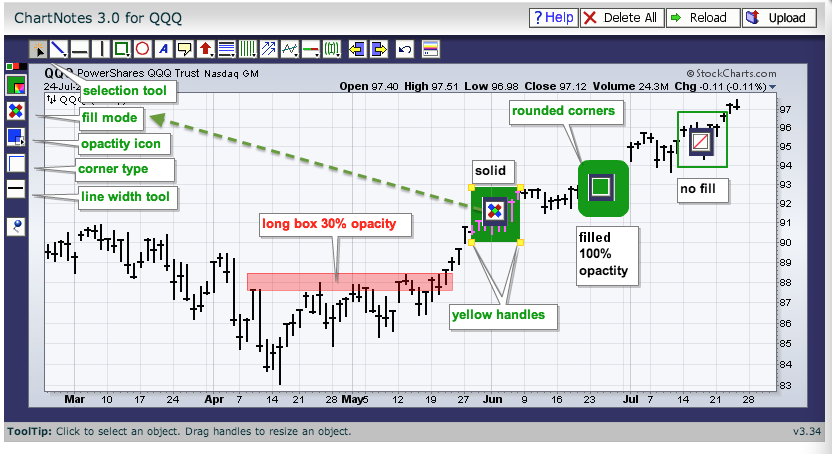
Choose the filled option and then adjust the opacity using the icon just underneath. 30% opacity will create a shaded box that can be used to mark a support or resistance zone. Chartists can also change the thickness of the outside lines using the "line width" icon and round the corners using the "corner type" icon. Note that these icons are only visible when a shape has been selected. Use the selection tool to make sure it is selected and the icons are available.
