|
|
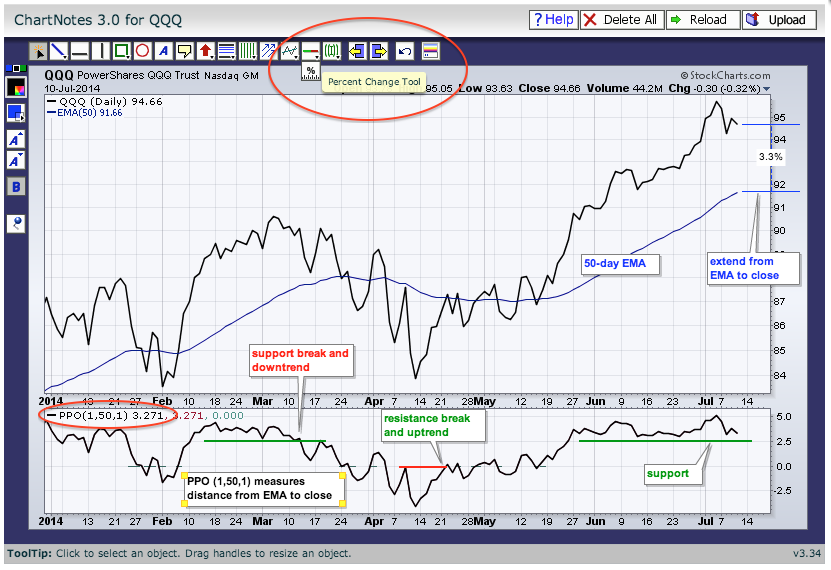
There are two ways to measure how far above or below the price is from a moving average. First, as Greg Schnell has shown us several times, chartists can use the "percentage change tool" when annotating a SharpChart. This tool can be found just under the icon with the green-red line (support-resistance tool). Click to select, move to the moving average and click-drag from the moving average to the price. The example above shows a 3.3% difference between the 50-day EMA and the closing price.
Chartists can also plot the differential using the Percentage Price Oscillator (PPO). To measure the difference between the 50-day EMA and the close, use Percentage Price Oscillator (1,50,1). The first 1 is for a 1-day EMA, which is just the closing price. The 50 is for a 50-day EMA. The second 1 is for the signal line. I used 1 to make is equal to the actual PPO and this essentially hides it.
As the chart above shows, the PPO(1,50,1) is at 3.271%, which rounds out to 3.3%. Notice that this indicator can trend for short periods. The PPO broke support the second week of March and moved lower into April with a series of lower lows and lower highs. After a breakout in late April, the indicator trended higher with a series of higher highs and higher lows into early July. Most recently, the indicator has been flat. A break below support would be negative for momentum and could foreshadow a correction.


