
|
Chartists can analyze relative performance by viewing the StockCharts Technical Rank (SCTR) in a Sector Market Carpet. There are two ways to measure relative performance. First, chartists can compare the absolute SCTR values, which range from zero to one hundred. Low values (0 to 30) signal relative weakness, while high values (70 to 100) signal relative strength. Second, chartist can compare the change in SCTR values. A big gain in the SCTR signals relative strength for that period, while a big loss signals relative weakness for that period. Let's look at some examples.
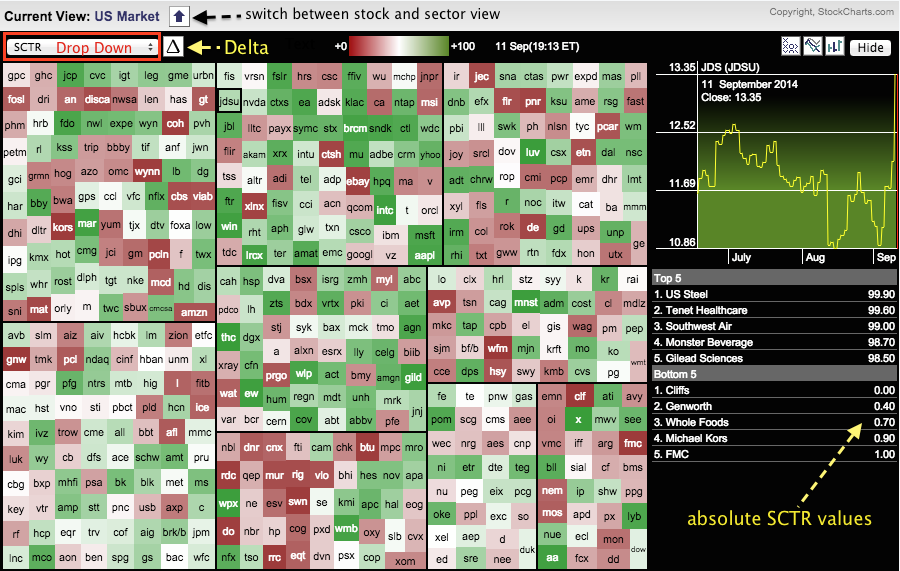
The chart above shows the Sector Market Carpet with the SCTR indicator in absolute mode. Notice that SCTR is visible in the drop down at the upper left and the Delta sign is NOT shaded, which means it is NOT selected. The strongest stocks have dark green squares and the weakest have dark red. The tables on the right show the top and bottom five.
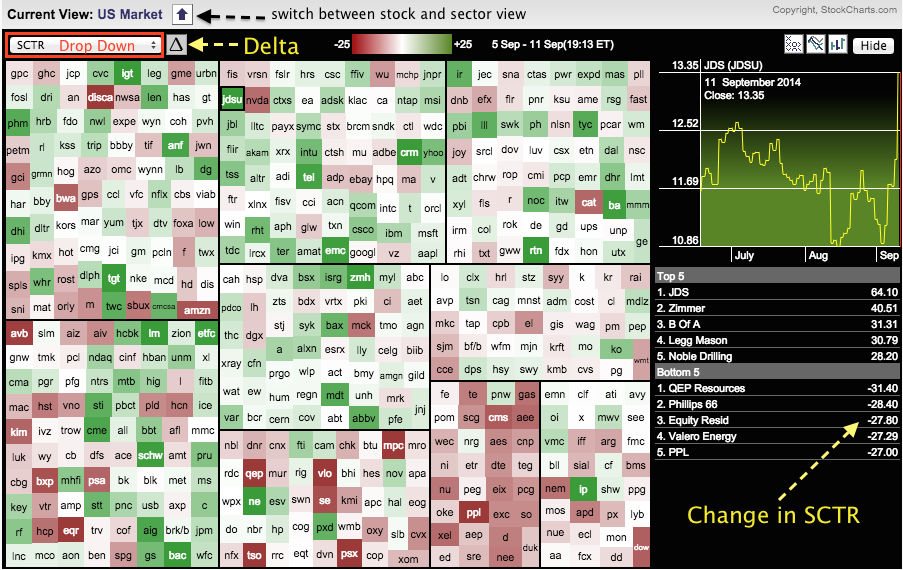
The second chart shows the SCTR indicator in change mode. Notice that the Delta signal is shaded, which means it is selected. Chartists can use the slider at the bottom right to set the date range. I have chosen five days to measure a one week change in the SCTR. The table on the right shows the five biggest gainers and the five biggest losers. Three of the five biggest losers come from energy. Two of the five biggest gainers come from finance. Don't forget that there are many ways to change the viewing options. First, hover over the carpet and right click. Second, use the arrow at the top left to switch between sector overview and individual stocks. Third, double click on any square to focus on that particular sector. You can learn more about Market Carpets by viewing our video tutorials.
