|
|
In addition to stocks, ETFs and Mutual Funds, StockCharts provides data for hundreds of indexes and market indicators as well as dozens of economic indicators and futures contracts. The index and indicator symbols are prefixed with a Dollar sign or an exclamation point. Examples include $SPX for the S&P 500 or !GT200SPX for the Percentage of $SPX Stocks above their 200-day EMA. Symbols for futures contracts are prefixed with a caret. Examples include ^CLZ14 for December Light Crude and ^GCZ14 for December Gold. Symbols for economic indicators begin with two Dollar signs. Examples include $$CPI for the Consumer Price Index and $$M2 for M2 Money Supply.
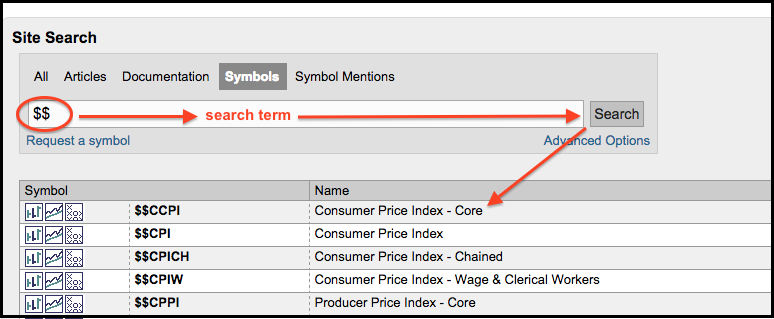
So how can I find a list of these symbols? The quickest way is with a search of the symbol catalog. A link to the symbol catalog can be found at the top-right of every webpage. Simply search for $$ to find the economic indicators available or search for ^ to find the futures contracts.
The index and indicator symbols are a little more complicated because there are so many (literally hundreds). Chartists can search for INDX to see all of these symbols. You can easily refine your search by adding a few required terms. Search for "INDX and Stocks and 200" (without quotation marks) to see all the indicators that use the 200-day moving average. Using "and" means the term is required in the results.
Users can also learn about our index, market indicator, economic and futures symbols on the symbol documentation page. This page contains over 50 articles explaining the symbol groupings. Here you can learn about the Intellidex Indices, the Morning Star Indices or the S&P Sector/Industry Symbols.


