
|
With the DecisionPoint merger, StockCharts acquired several sentiment indicators with long histories. Sentiment indicators measure the bullishness or bearishness of a particular group. These indicators are often used as contrarian indicators to identify market extremes. Excessive bullish sentiment is viewed as potentially bearish for the stock market, while excessive bearish sentiment is viewed a potentially bullish. Chartists can plot these indicators separately or plot the difference between bulls and bears. StockCharts provides sentiment data from the American Association of Individual Investors, Investors Intelligence, Wall Street Sentiment and Rydex. The chart below shows some special techniques for charting these indicators. A brief explanation and the symbol pairings for each group can be found below the chart.
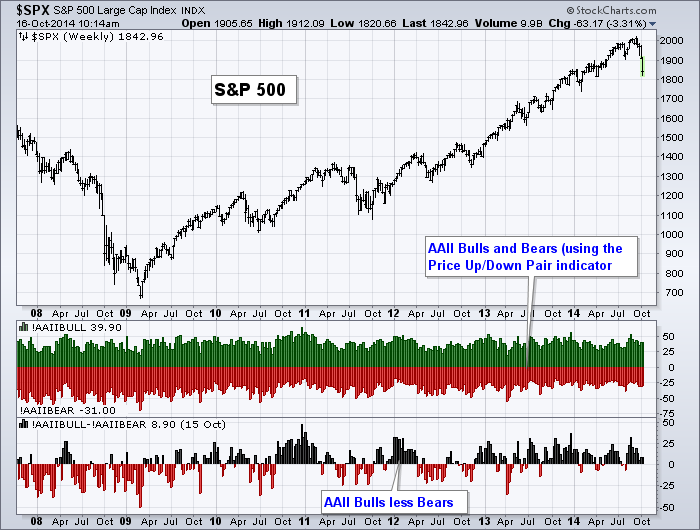
The chart above shows the AAII indicators using two special techniques. The first indicator window shows bulls and bears using the "Price Up/Down Pair" indicator. Chartists simply enter two symbols in the parameters box and separate them with a comma. The first indicator is plotted up and the second indicator is plotted down. The second indicator window shows the difference using the minus function. This can be charted by selecting "Price" as an indicator and then putting the two indicators in the parameters box with a minus sign in between.
The American Association of Individual Investors (AAII) surveys its members once a week for their investment stance. These numbers are posted on Thursdays. Symbols: !AAIIBULL for bulls and !AAIIBEAR for bears.
The Wall Street Sentiment Survey is provided by Mark Young of WallStreetSentiment.com. Mr. Young surveys a group of experienced traders and technical analysts for their opinion on the stock market. These numbers arrive over the weekend and are usually updated on Mondays. Symbols: !FFBULL for bulls and !FFBEAR for bears.
There are also some sentiment indicators available from the Rydex funds. Instead of surveys and sentiment, these indicators measure the actual assets in the Rydex bull funds and bear funds. Symbols: !ASETBULLI for total assets in Rydex bull funds and !ASETBEARI for total assets in Rydex bear funds.
