|
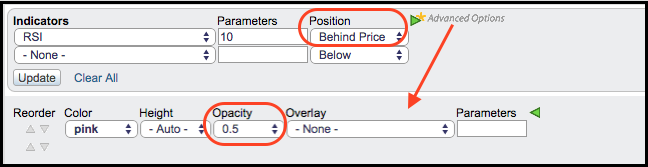
Chartists can position an indicator above the main window, below the main window or even in the main window, which puts it behind the price plot of the underlying security. It is easy to compare price movements with indicator movements when the indicator is placed right behind the price chart. The example below shows the Nasdaq 100 ETF (QQQ) with 10-day RSI behind the price plot.
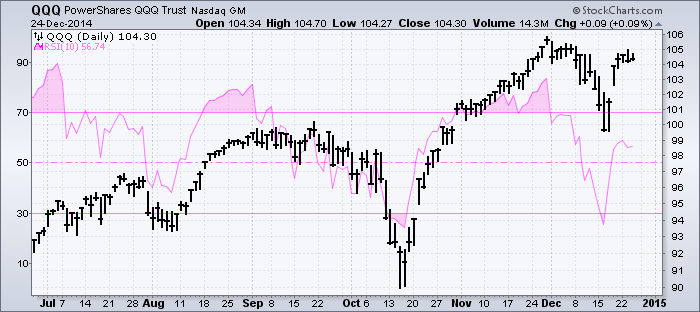
Chartists can also use the advanced indicator options to change the color and opacity settings. In this example, I am showing RSI in pink and setting opacity at 50% (0.5). Pink allows RSI to stand out, while the 0.5 opacity setting makes the RSI plot 50% transparent. You can do this with MACD, the Stochastic Oscillator or any indicator at StockCharts.