|
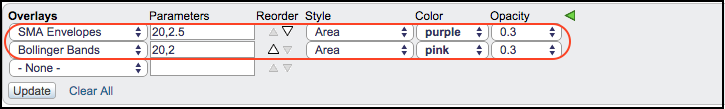
Bollinger Bands and Moving Average envelopes are indicators with two outer lines based on a moving average. Chartists can view these indicators as just lines or really make them stand out by setting the "Style" as "Area". This setting essentially shades the area between the outer lines and colors the indicator, which makes it really easy to see Bollinger Band contractions or breakouts.
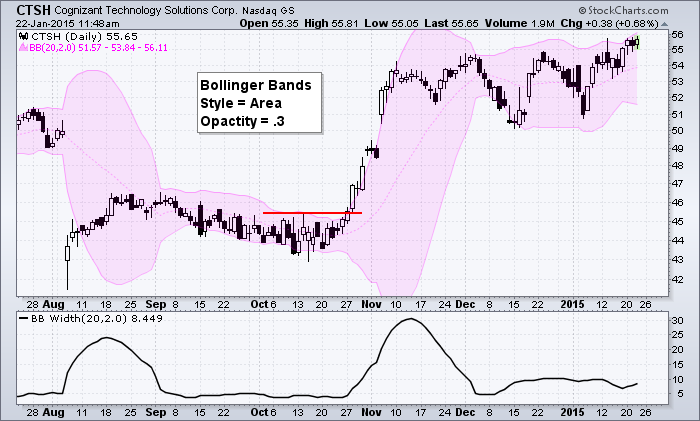
The example above shows Cognizant Technology (CTSH) with Bollinger Bands in pink. In addition, the opacity is set at .30 to make them a little more transparent (and less pink). Notice how easy it is to spot the Bollinger Band expansions and contractions. The Bollinger Bands contracted from early September to mid October as the stock edged lower (from 46.5 to 43). The rally started when CTSH broke above the upper Bollinger Band and resistance on October 27-28.
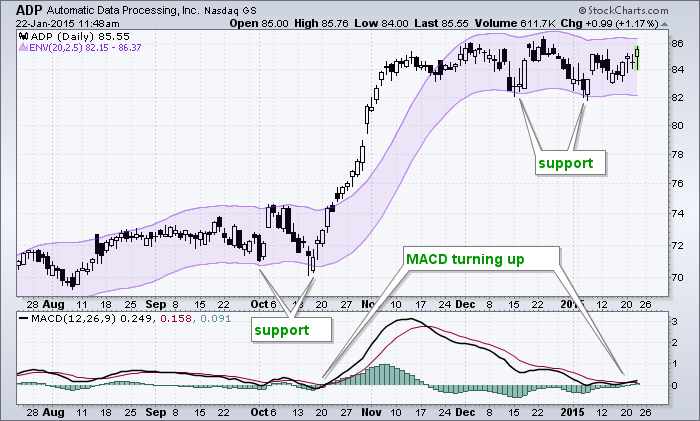
The chart above shows Automatic Data Processing (ADP) with moving average envelopes (20,2.5). These are 2.5% bands above and below a 20-period simple moving average. Notice how ADP held the lower envelope in October (on a closing basis), and then broke out the third week of October. The lower envelope is now acting as support (on a closing basis).