|
|
Shifting a moving average is not as crazy as it may seem. First, chartists may want to compare the current day's price against the prior day's moving average value. To do this, one needs to shift the moving average forward one period. Second, a 50-day moving average is the average of the last fifty days and some chartists like to show this value in the middle of that 50-day period. This is also known as a centered moving average.
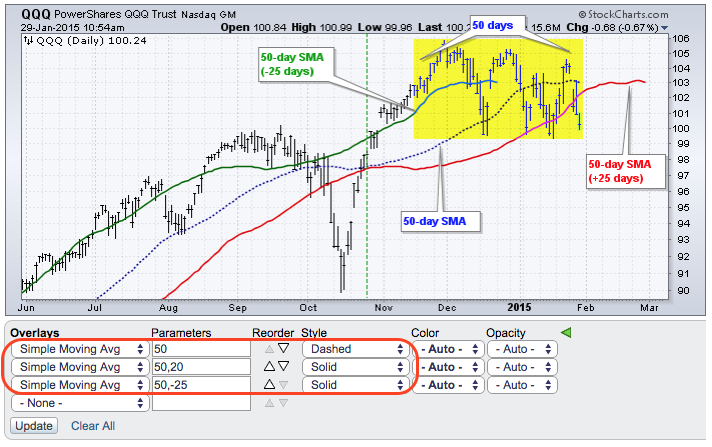
Chartists can shift (displace) a moving average forwards or backwards by adding a comma and number to the parameters. Adding a comma and a number to a 50-day moving average (50,25) would shift it forward 25 periods, which would put it in the future. A moving average can be shifted back by preceding the number with a minus sign (50,-25). This would shift a moving average back 25 periods, which would put it in the middle of the lookback period (50 days). The chart above shows a normal 50-day SMA in blue, a forward-shifted moving average in red and a centered moving average in green.
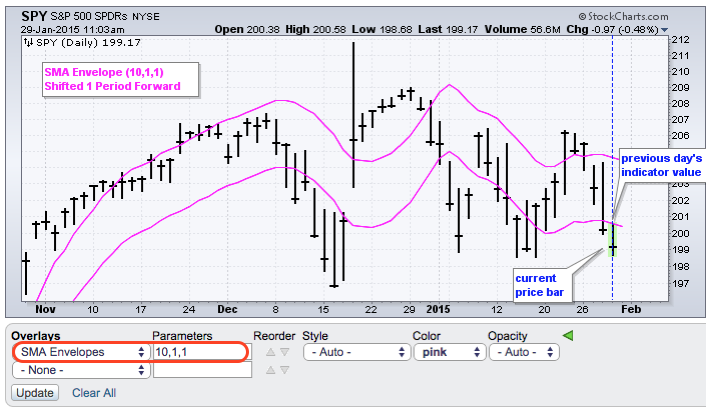
SharpCharts users can also shift indicators that use moving averages. These include Bollinger Bands, Keltner Channels, SMA Envelopes and Price Channels. The example above shows SMA Envelopes shifted forward one period (10,1,1). The extra 1 at the end is the shifting parameter. This lines up the current price bar with yesterday's indicator value. This is helpful if you want to know when today's price action is enough to break above or below the prior day's indicator value.


