|
|
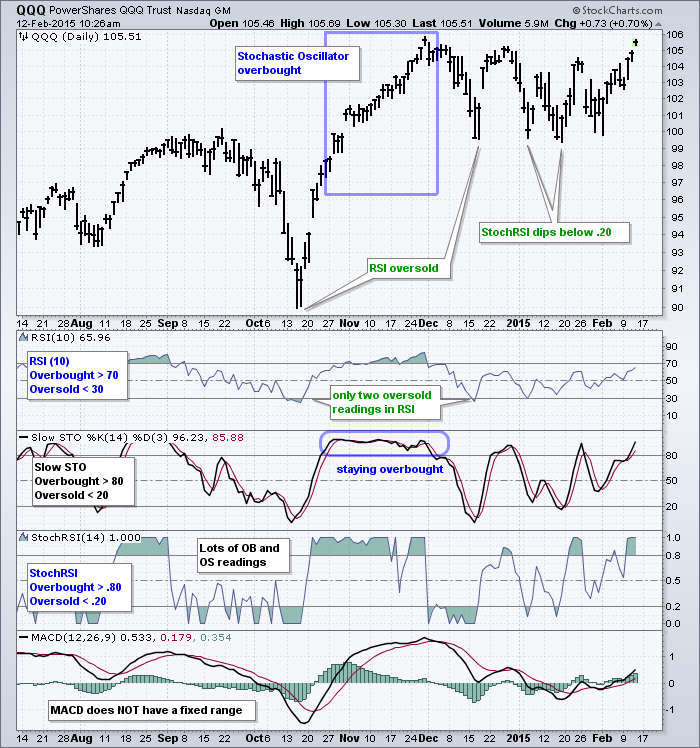
In general, momentum oscillators with a fixed range are best suited for identifying overbought and oversold conditions. These include RSI, the Stochastic Oscillator and StochRSI. RSI and the Stochastic Oscillator fluctuate between zero and one hundred, while StochRSI fluctuates between zero and one. Momentum oscillators like MACD and the Percentage Price Oscillator (PPO) do not have fixed ranges and this makes it more difficult to identify overbought and oversold conditions.
The QQQ chart below shows RSI(10), the Slow Stochastic Oscillator (14), StochRSI(14) and MACD, which is just shown for reference. First, notice that RSI is the least sensitive of the three fixed-range oscillators because there were only two oversold readings in seven months. I even shortened the look-back period from 14 to 10 in order to increase sensitivity. Second, notice that an oscillator can become overbought and remain overbought in a strong uptrend. The Stochastic Oscillator moved above 80 on October 24th and remained above 80 until December 3rd. Third, notice that StochRSI is by far the most sensitive of the three. This is because StochRSI is an indicator of an indicator. 14-period StockRSI is the 14-period Stochastic Oscillator applied to 14-period RSI, which means it is measuring the momentum of momentum.
There are two things chartists should keep in mind. First, look for oversold readings when the bigger trend is up and overbought readings when the bigger trend is down. An oversold reading in an uptrend signals a pullback. Second, set a trigger to signal an end to overbought or oversold conditions. Each oscillator has a centerline that can be used for such a signal. For example, a move below .20 triggers an oversold condition in StochRSI. This condition ends when StochRSI surges above .50, which puts it in the upper half of its fixed range.


