 Years ago, I was looking to hire a junior analyst to focus on database management and creating new data visualizations. We received quite a large pile of resumes; I'll never forget spending an afternoon flipping through papers until one of the them jumped out at me.
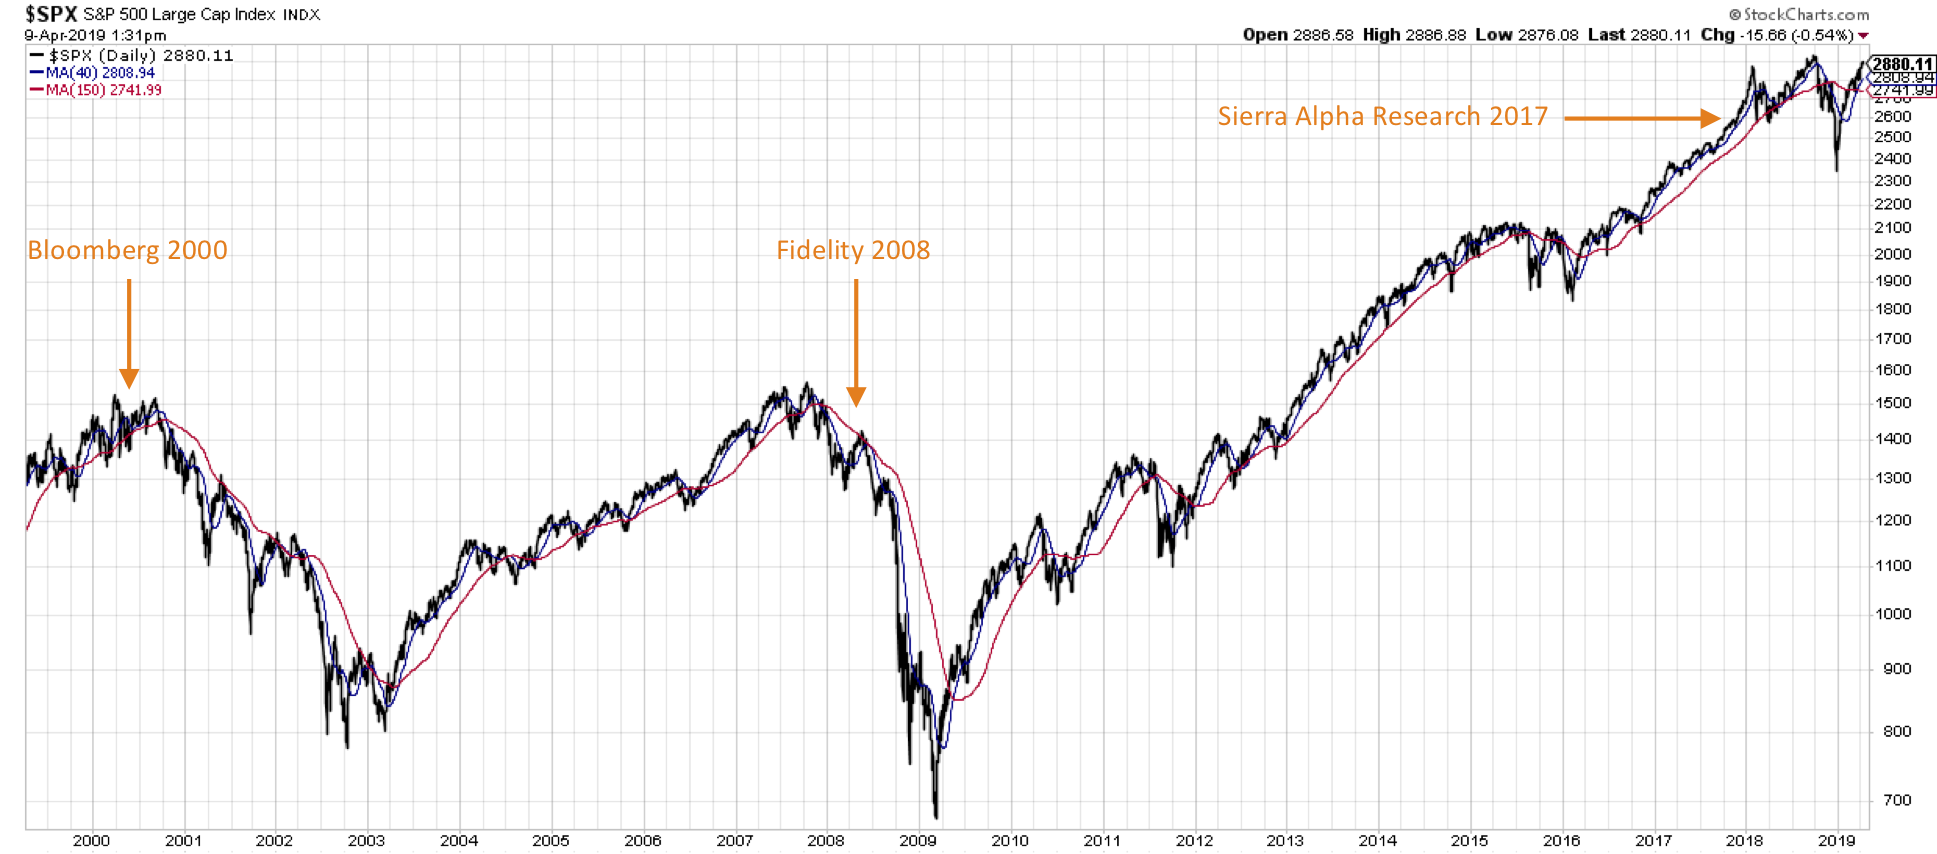
What stood out from all the other boring resumes I had reviewed? This applicant had actually put a chart of the S&P 500 at the top of his resume, including notations on the chart that identified key moments in his career history.
Talk about being creative and knowing your audience! Needless to say, we hired him.
I first entered the financial industry in June of 2000. If you know your market history, you know that this was soon after the March 2000 market top. It still wasn't clear at that point that the top was in - everyone was still pretty much in bullish mode.
The fact that I began my investing journey right after the 2000 market top has affected me throughout my career. I tend to mistrust uptrends and expect downtrends, especially when the market approaches a major resistance level.
Compare this to one of my former analysts, who started his career in 1982. Again, if you know your market history, you're probably aware that this was just prior to the biggest bull market in U.S. history. Just as you'd expect, this analyst tended to be pretty bullish, usually expecting markets to continue higher and considering most market pullbacks to be opportunities to add, not reasons to panic.
My friend and mentor Greg Morris once shared a chart of market returns by decade. Overall, equities have provided annual returns in the 6-8% range, depending on where you start the clock. But Greg's conjecture was that your starting point is critical as an investor.
For example, let's say that you started investing in June of 2000, when I started in the financial industry. How long did it take for me to make money, excluding dividends? Thirteen years. What if I had started in March 1973? Ten years. Ten years before I started to see legitimate capital appreciation. So, while equities have certainly been a long-term generator of great amounts of wealth, your starting point can do much to color your appreciate for this long-term market uptrend.
What does that mean for investors today?
Well, if a novice investor first bought shares in September 2018, then they've just gotten back to whole after the recent market rally. So far, all those investors have learned is that when the S&P approaches the 2950 level, the market tends to sell off.
At some point, that pattern will most likely break as the market continues its centuries-long uptrend. But what do the charts say about the market today?
First off, the S&P 500 has formed a cup-with-handle-type pattern, with the market forming a large basing pattern and a shallower pullback that appears like the "handle" of the coffee cup.
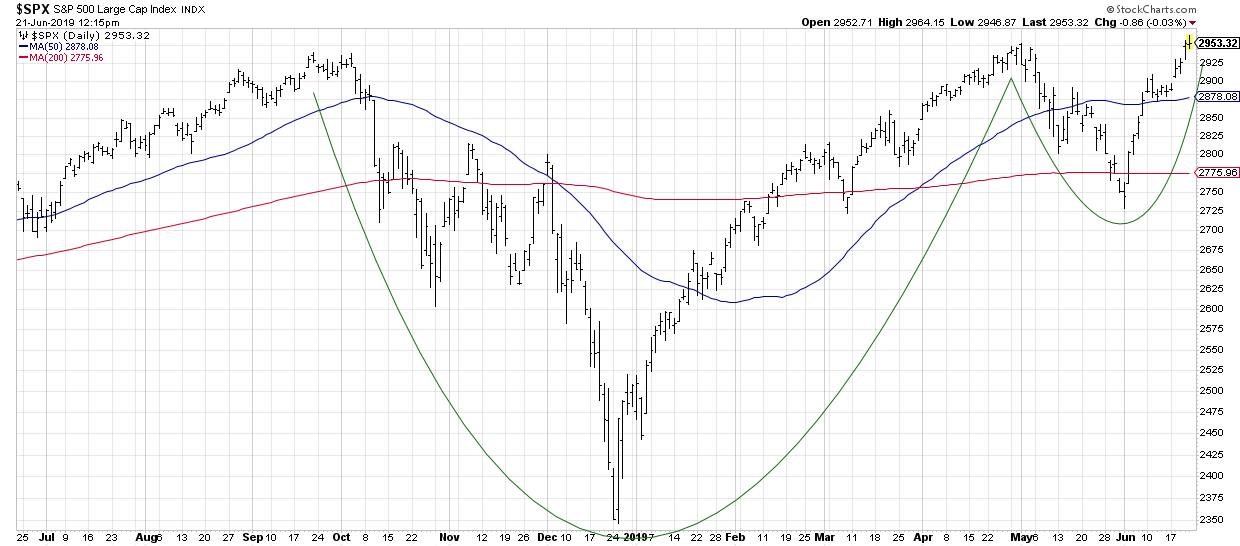 I call this a "cup-with-handle-type" pattern because a true cup-with-handle has more of a rounded basing pattern, making it look more like a coffee cup. This pattern makes behavioral sense as there is a consistent resistance level (the "rim" of the cup) and the rounded bottom followed by a shallower retest suggests a building of momentum as buyers push the price higher.
A confirmed break above 2950, with a follow-through breakout above the key psychological 3000 level, would suggest much further upside for stocks through year-end and beyond. But what about breadth?
One of my favorite breadth charts tracks the advance-decline lines of the US cap tiers. This helps to illustrate strength or weakness, not just in the main headline indexes but also in the smaller companies that are often a better signal of market health.
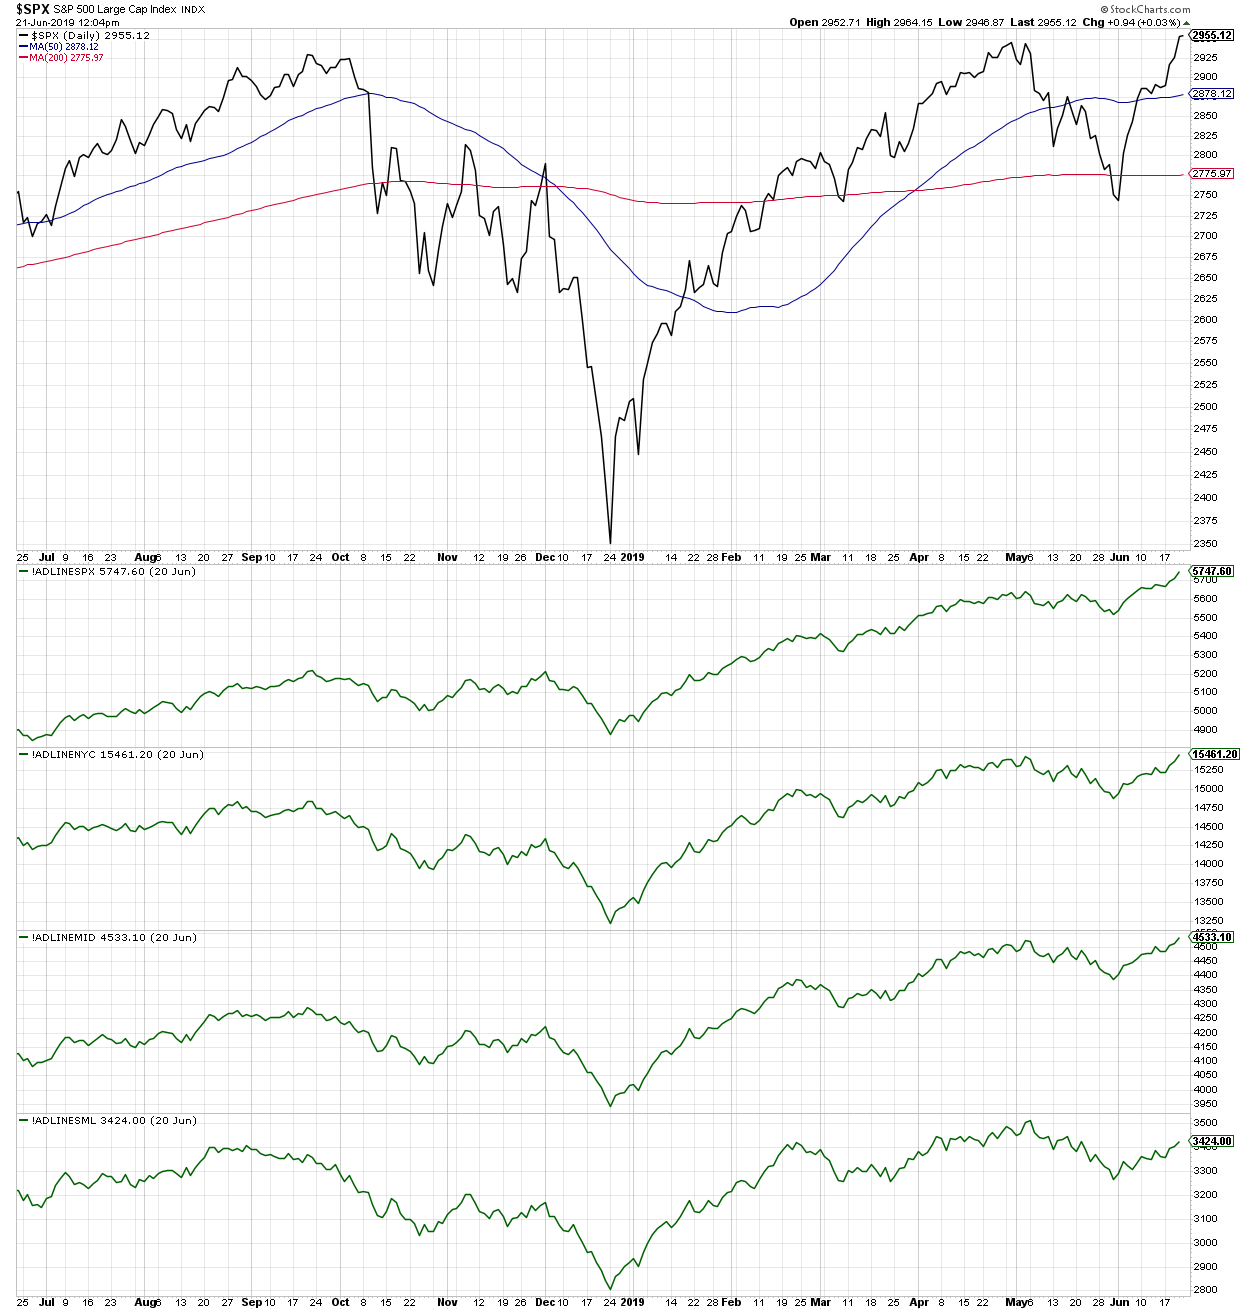 Here, we see that breadth remains strong across cap tiers. Even though small-cap and micro-cap indexes are testing declining moving averages from below, the advance-decline lines suggest a healthy market underneath the hood.
The starting date of your investing experience will likely have a profound effect on how you approach the markets. By developing a solid game plan and gathering evidence to make your decisions, you will find the emotional connection to your start date becomes less and less of a burden.
RR#6, Dave
David Keller, CMT President, Sierra Alpha Research LLC
Disclaimer: This blog is for educational purposes only and should not be construed as financial advice. The ideas and strategies should never be used without first assessing your own personal and financial situation or without consulting a financial professional.
The author does not have a position in mentioned securities at the time of publication. Any opinions expressed herein are solely those of the author and do not in any way represent the views or opinions of any other person or entity.


