Any time I have a chance to interview other market strategists, I like to ask them about their One Chart. That is, "What's the one chart that you think is the best tell on the markets right now."
To rephrase, if you could only have one chart (besides a simple chart of the S&P 500, of course) to get a read on the overall market environment right now, what would it be?
This often leads really cool discussions on intermarket analysis, sentiment, macroeconomic factors, or more obscure indicators and configurations of which I'm less familiar.
I was reading Arthur Hill's fantastic piece on the state of the stock market, and I started to think what my own "one chart" would be right about now.
My first inclination was to flip through the Mindful Investor Chart List to see what stood out to me, and sure enough, one chart immediately bubbled to the top of the list.
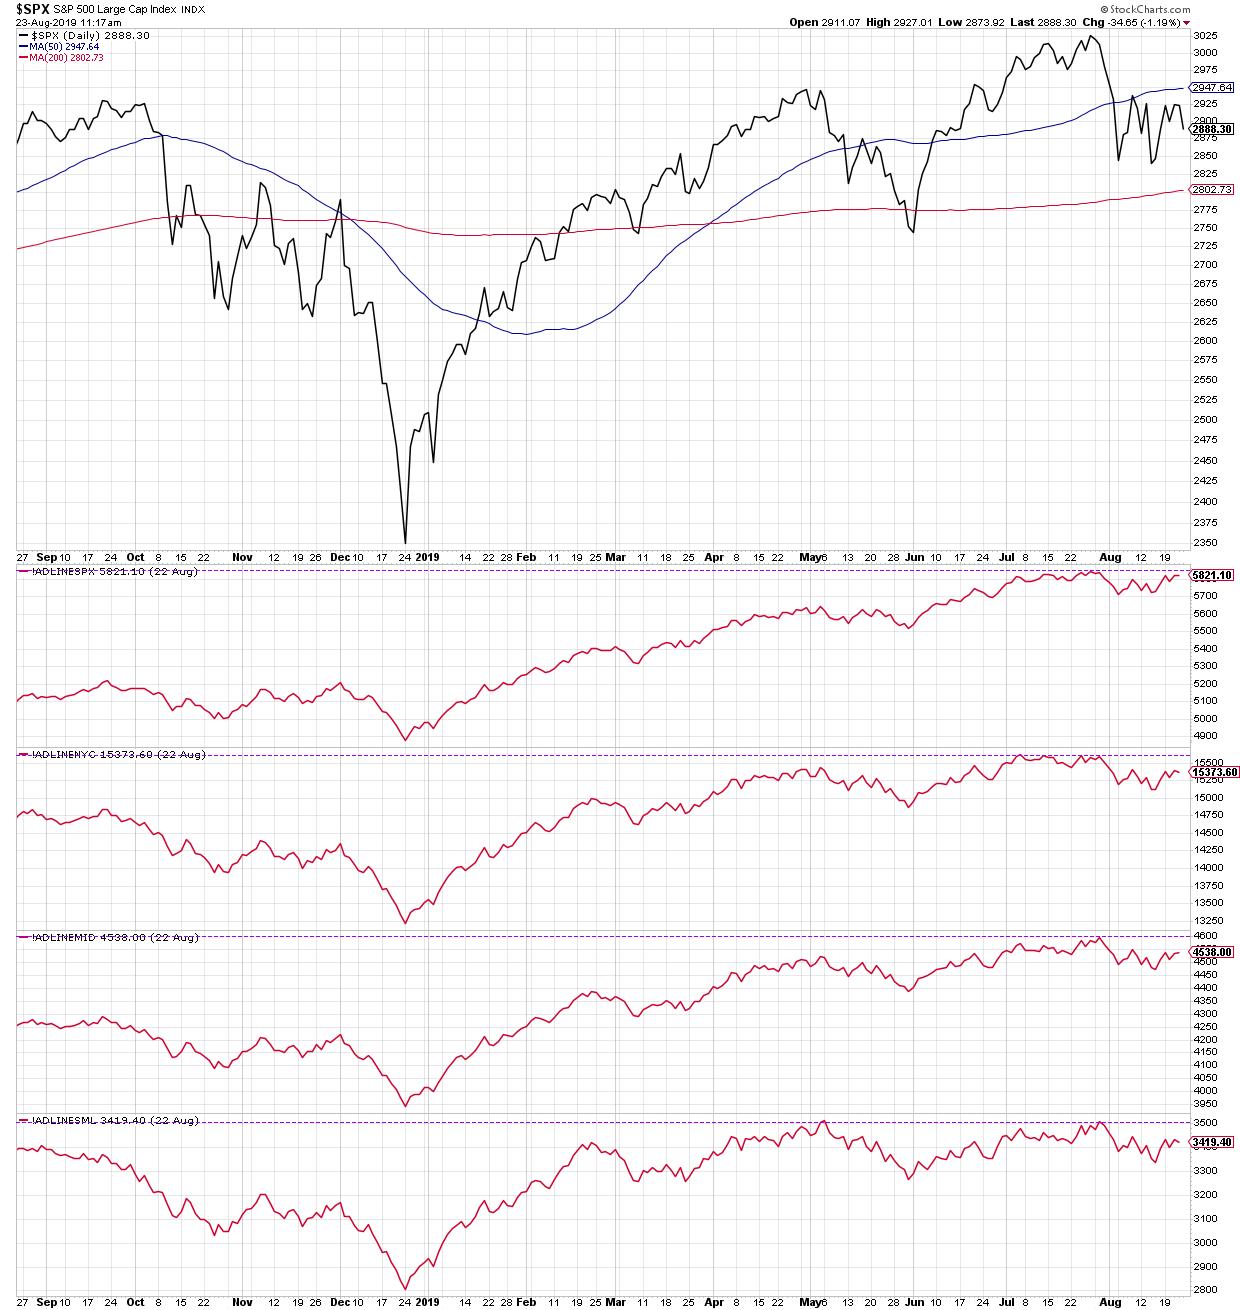
This chart shows the cumulative advance-decline lines for the large cap, mid cap and small cap indices in the US.
First off, you'll notice that while most of the cap tiers saw a higher A-D line at the end of July, the A-D line for small cap stocks never eclipsed its May high. This is in line with the divergences Arthur mentioned with the market indices themselves.
Now we've seen all four of the cap tier breadth measures move lower as the market has corrected in the month of August.
So what would constitute a bearish configuration for this chart?
First, a divergence between small and large cap stocks. Check.
Second, the A-D lines establish a lower high. Not quite there yet but threatening to do so as we speak.
Third, the A-D lines make a new lower low.
Finally, the breadth lines break down through their May lows, confirming a new downtrend in market breadth.
What would tell me that the current selloff is just a short-term pullback? Basically, we do not complete the four-step process I've outlined above.
If we do complete the four-step process? Then look out below.
RR#6,
Dave
David Keller, CMT
President, Sierra Alpha Research LLC
Disclaimer: This blog is for educational purposes only and should not be construed as financial advice. The ideas and strategies should never be used without first assessing your own personal and financial situation, or without consulting a financial professional.
The author does not have a position in mentioned securities at the time of publication. Any opinions expressed herein are solely those of the author, and do not in any way represent the views or opinions of any other person or entity.
