"Technical analysis is a windsock, not a crystal ball." - Carl Swenlin
For me, technical analysis is not about trying to predict the future. So when I'm asked to give my S&P 500 target for year-end, I try not to giggle as I answer. Because at the end of the day, anything I could say is simply a guess.
To be clear, any predictions of where a particular asset will be at some point in the future, based on technical or fundamental data, is pure speculation. So what's the point of all this?
I learned technical analysis in the early 2000s, and my introduction to investing was watching the tech bubble burst. I saw how some investors were completely caught off guard by the rotation from bull phase to bear phase. At the same time, I was impressed by technically-oriented investors that saw clear signs of deterioration that suggested increased risk.
In other words, you don't need to predict the future. You just need to follow the trends!
I'm presenting a FREE webinar on Tuesday, September 14th at 1:00pm ET called "How to Avoid Confirmation Bias". We'll discuss how confirmation bias can creep into your investment process and how to minimize its impact by focusing on the evidence using charts. Sign up HERE for this free webinar!
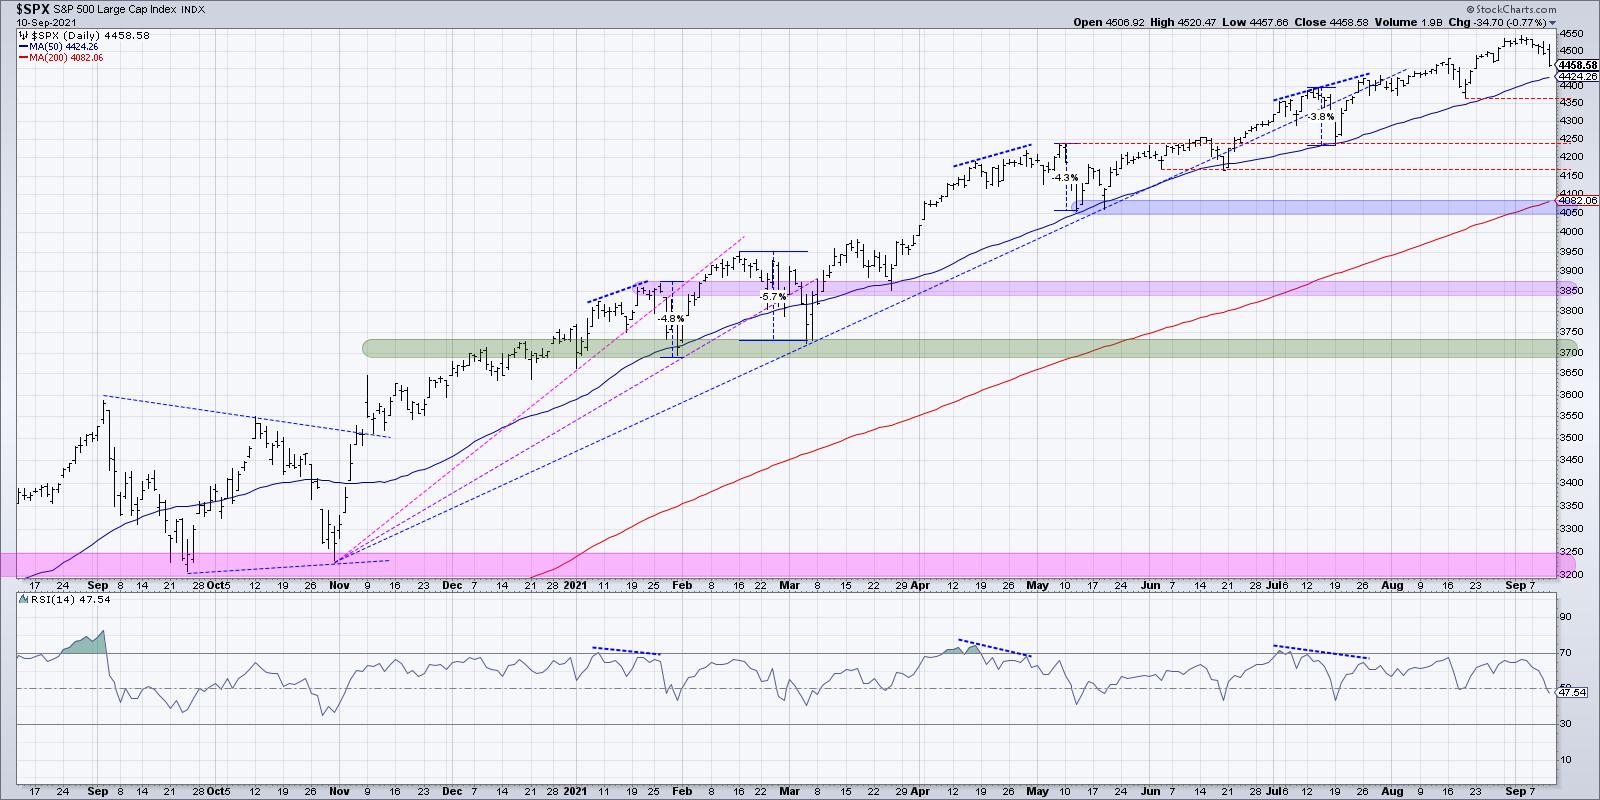
That brings me to the current chart of the S&P 500. The major equity indexes have made new all-time highs every month so far in 2021. Charles Dow taught us over 100 years ago that an uptrend is comprised of higher highs and higher lows, and the recent market activity has been exactly what Dow was talking about.
As a student pilot, I was taught to always be prepared for an emergency. And the best time to prepare for emergencies was when everything was going just fine, the plane was operating well and you were flying straight and level.
On that note, here are four key signals that would indicate to me that the bullish phase has indeed exhausted.
First, the S&P 500 would fail to make a higher high. Each new month has seen the S&P break to new highs as stocks have traded onward and ever upward. If the index would attempt to make yet another new high and fail, it could indicate that the buying power from earlier in the year has dissipated. It's worth noting that technical indicators like head-and-shoulders patterns and even Elliott Wave have a foundation in this basic concept of identifying when highs are no longer eclipsing the previously established high.
Second, as you may guess from the Charles Dow comments, would be a lower low. A break below the most recent swing low (top red line around 4360) would mean that the most recent support level was not holding. That could suggest an exhaustion of buyers and/or increased selling pressure.
Third, the 50-day moving average, which has served as consistent support through 2021, would need to fail. One of the most widely acknowledged technical patterns in 2021 has been the 50-day moving average and its ability to repel numerous tests during this bull market phase. The consistency of this moving average would tell me that a pullback to the 50-day is most likely a "buy on the dip" opportunity, as it has been all through this year.
But what if this widely followed support level actually fails? What if the price breaks the 50-day moving average and then continues lower? Once investors realize that the assumed support is no longer going to hold, I could see a scenario where a flood to the exits causes a sudden and significant drop in the S&P 500.
Finally, we'd need to see the RSI break below 40. In bull market phases, the RSI tends to become overbought during upswings (see the January, April and July peaks) and remain above 40 on any pullbacks. Five of the seven brief pullbacks in 2021 have seen the RSI come right down to 40 before bouncing higher. If the RSI would break below 40, this could indicate what I call a "change of character" where the configuration of the chart evolves to the point that you have to acknowledge a change in overall trend.
This last week was a "digestion week" where investors processed the strong gains in previous weeks and needed to reset before another move higher. As Greg Morris once said, "New highs are almost always good news; it's just the last one that is not."
The good news is you don't have to know ahead of time which new high will be the last one. You just need to have a good exit strategy in place and let the chart tell you when the conditions have changed!
Want to experience this article in video form? Just click below.
RR#6,
Dave
P.S. Ready to upgrade your investment process? Check out my free course on behavioral investing!
David Keller, CMT
Chief Market Strategist
StockCharts.com
Disclaimer: This blog is for educational purposes only and should not be construed as financial advice. The ideas and strategies should never be used without first assessing your own personal and financial situation, or without consulting a financial professional.
The author does not have a position in mentioned securities at the time of publication. Any opinions expressed herein are solely those of the author, and do not in any way represent the views or opinions of any other person or entity.


