I recently gave a webcast on how to avoid one of the sneakiest and most prolific of the behavioral biases: confirmation bias. Here's how it works. Instead of gathering evidence and then making a decision, you reverse the two. You actually make your decision first and then you begin to gather the evidence.
So what happens as you start reviewing the available information? You basically assign greater value to any evidence that supports your decision and mentally push away any evidence that goes against your decision. Essentially, you look for information that will confirm your already completed decision.
If you think a little deeper about this one, you'll realize that your goal is not to make a good decision, but rather to make yourself feel better about the decision you've already made. Does that sound like a great way to manage your portfolio? It's not.
So how do we minimize the impact of confirmation bias?
Pilots face the same issue of needing to make split-second decisions and to do so without being affected by the emotional experience of what's happening. How do they manage to do this consistently? By using checklists. A lot of them.

When I was learning to fly a Cessna 172R, I had a checklist for preflighting the airplane, another one for right before takeoff and even one in case of an engine cut-out in midair. You used the checklists every time you flew the airplane, because that was the way you minimized the chance of human error.
When was the last time you used a checklist for a trade? I mean spelling out the evidence you were going to evaluate, keeping track of the results of each step and then making an investment decision based on the weight of the evidence?
Here's the checklist I use to evaluate 90% of the charts that I review. You should use a written checklist, especially as you're getting started. If you don't have a checklist, you should write one down. Now. If you don't know how to get started, you're welcome to use mine as a starting point!
Let's take an example of GOOGL a couple years ago and see how the chart checks out.
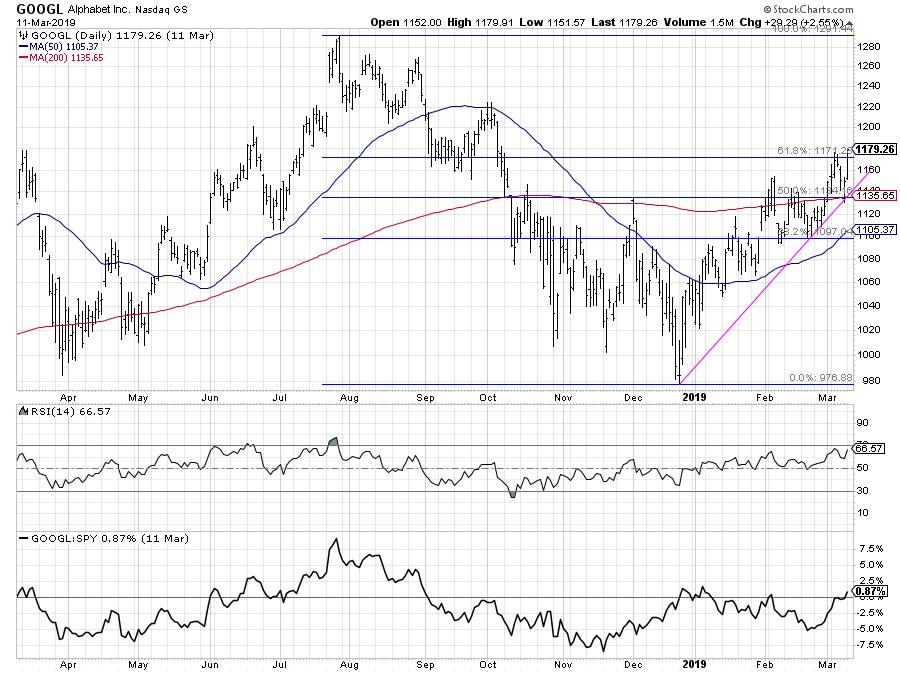
Step 1: Dow Theory
Is the chart making higher highs and higher lows? Yes.
Step 2: Trend Lines
Are there any key trend lines in play? Yes, I can connect the December 2018 and February 2019 lows to track this confirmed uptrend.
Step 3: Moving Averages
Where is the price relative to the moving averages? Are the moving averages sloping up or down? The price is above two upward-sloping moving averages.
Step 4: Pattern
Any important price patterns that I recognize on the chart? I could argue that February 2019 showed a pennant pattern that resolved to the upside.
Step 5: Support/Resistance
Where is the price relative to key support and resistance levels? GOOGL had recently broken above the February high and just eclipsed the 61.8% Fibonacci retracement level.
Step 6: Confirmation
Can I confirm price action with any technical indicators? The RSI is in a bullish range, well above 40 and not yet overbought.
Step 7: Relative Strength
How is this stock performing relative to its peers? GOOGL is showing positive relative strength, and the RS line is close to making a new six-month high.
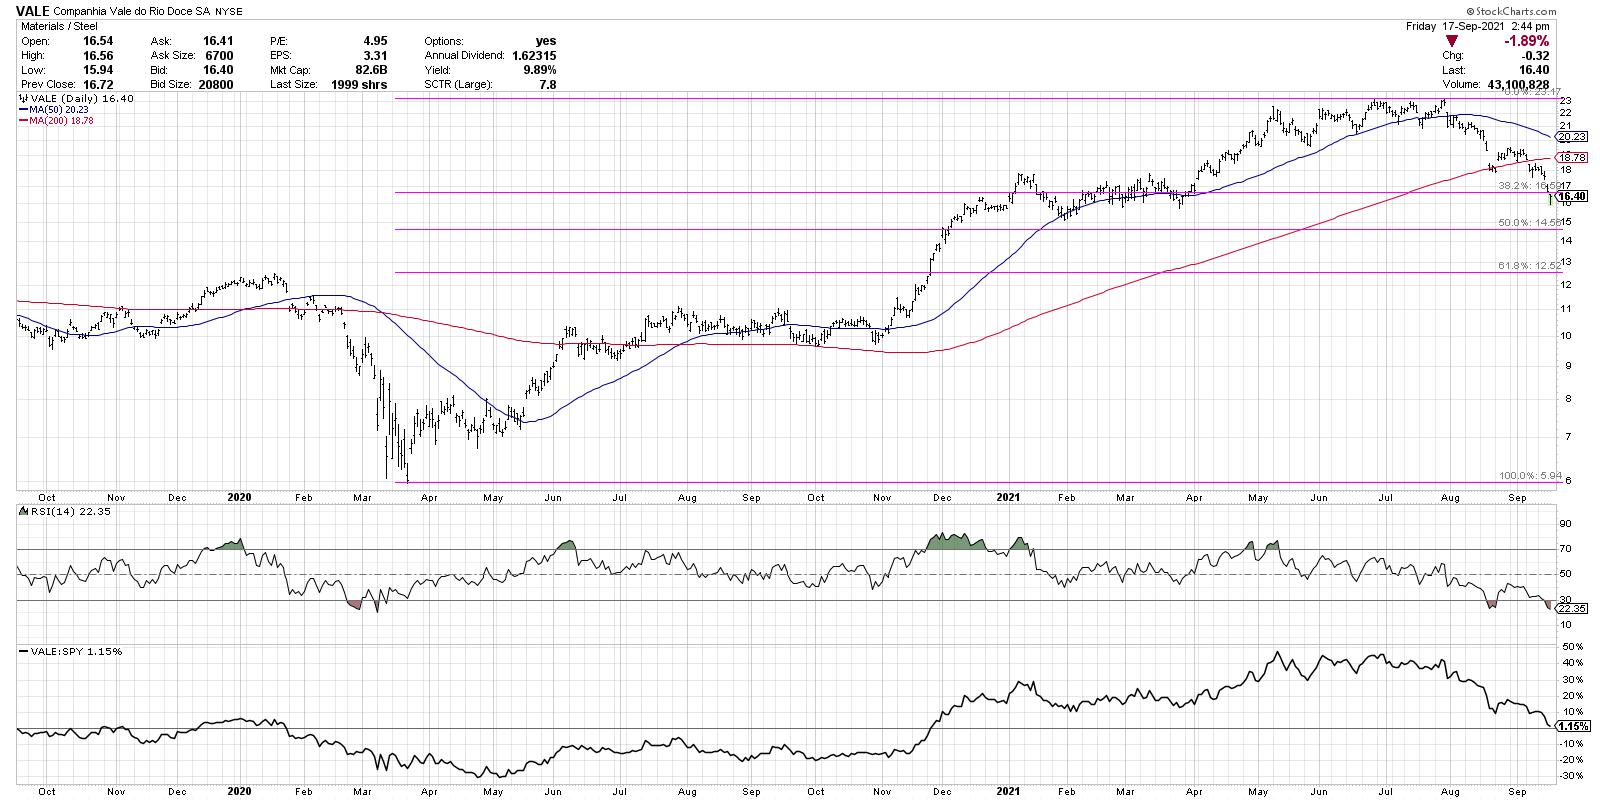
Overall, the weight of the evidence in this example seems positive. Now, try the same seven steps on another chart, VALE.
The most successful investors I've worked with surround themselves with resources and routines they need to add discipline to their investment process. Checklists are one way to take the guesswork out of technical analysis and minimize confirmation bias by focusing on the weight of the evidence!
Want to digest this article in video format? Here we go:
RR#6,
Dave
PS- Ready to upgrade your investment process? Check out my free course on behavioral investing!
David Keller, CMT
Chief Market Strategist
StockCharts.com
Disclaimer: This blog is for educational purposes only and should not be construed as financial advice. The ideas and strategies should never be used without first assessing your own personal and financial situation, or without consulting a financial professional.
The author does not have a position in mentioned securities at the time of publication. Any opinions expressed herein are solely those of the author, and do not in any way represent the views or opinions of any other person or entity.


