Gold has captivated human beings for millennia, infatuated with its appearance and it scarcity. Gold has also attracted investors for its value in hedging inflation and providing a stable store of wealth during periods of uncertainty.
While there are many narratives for gold related to transitory inflation, the Fed's accommodative policies and its value as a safe haven, today we'll focus purely on the technical picture. To put it simply, why does gold remain in a bearish mode, and what would we need to see to rotate to a more bullish outlook?
The bear case starts with the moving averages. Here, we have a chart of the gold ETF (GLD) and the 200-day moving average is in red.
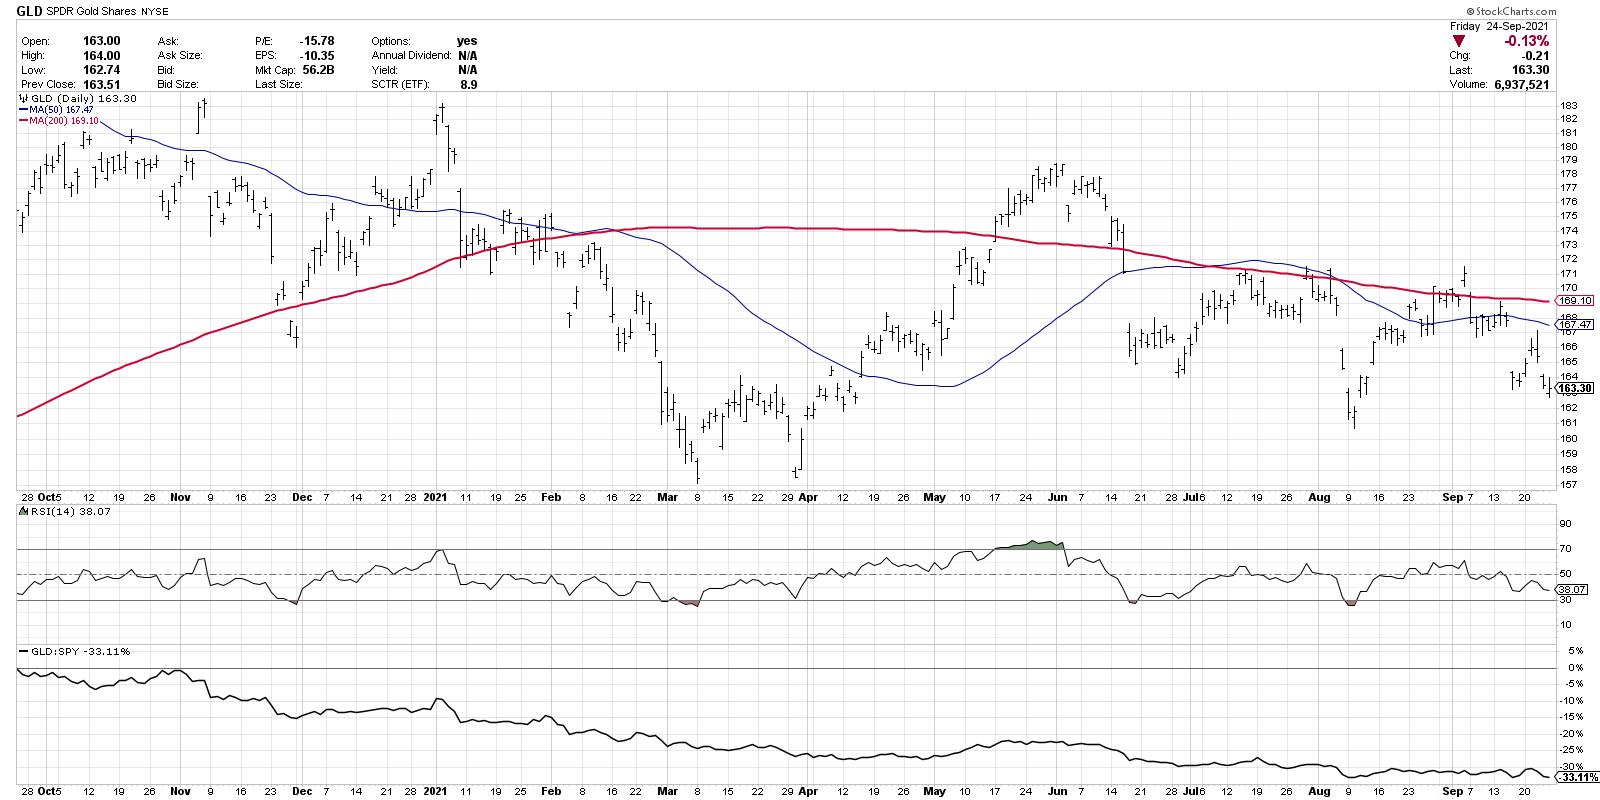
Notice how the 200-day moving average sloped higher for the first six months, then sloped lower through the next six months? Moving averages are designed to smooth out the noise of the day-to-day price movements. When you smooth out the noise on the GLD, you can see a clear rotation from bullish trend to bearish trend.

Next, notice how the price is currently below two downward-sloping moving averages. If you drop a list of tickers into the CandleGlance function on StockCharts, you can use the price and two moving averages on each chart to easily separate the leading charts from the lagging charts. GLD is clearly on the lagging list.
Speaking of lagging, the panel at the bottom shows the relative strength of GLD to the S&P 500 ETF (SPY). The relative line has been trending downwards for over a year, demonstrating how investors have not really benefited from owning gold over stocks.
Our second chart brings in three additional data points: RSI, Fibonacci retracements and trendlines.
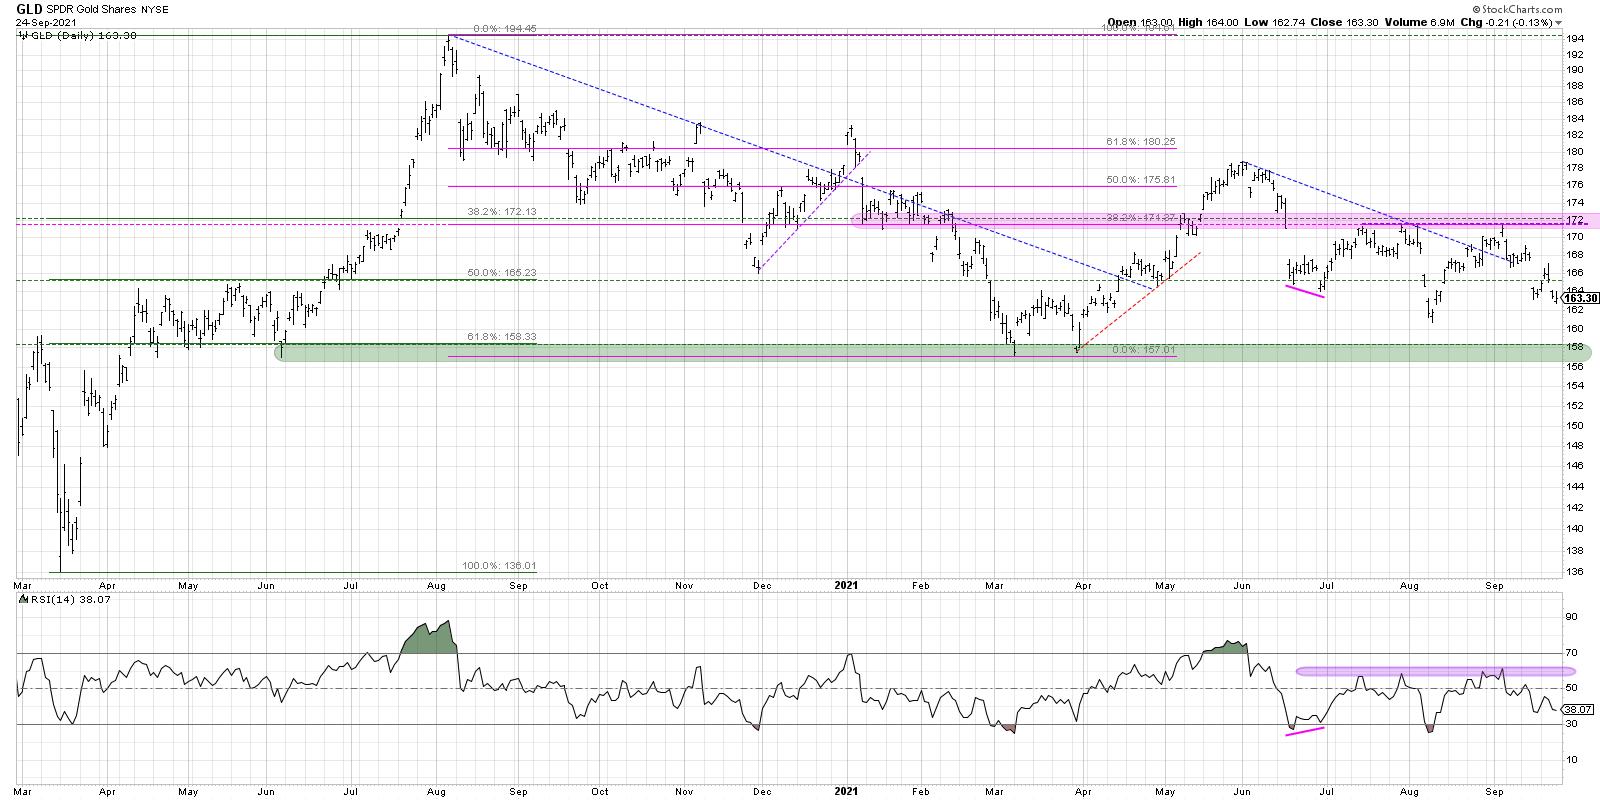
Here, we can see back to the March 2020 low, where gold and the S&P 500 bottomed out in the same month. Over the subsequent five months, the GLD rallied from a low around 136 to a peak right around 194. From there, it's been a slow and steady decline.
I've drawn a series of trendlines including August 2020-November 2020 and June 2021-August 2021. What do all of the trendlines drawn using significant highs over the last two years have in common? They ended with a failed breakout.
Trendlines are drawn to track the pace of a trend and, when the price breaks through the trendline, that should indicate a trend reversal. In the case of gold, the price has been punctuated by a series of failed breakouts, where the price was unable to hold above the breakout level. A chart where price is unable to breakout and follow-through to the upside is a chart in distribution mode.
Now let's look at Fibonacci retracements. If you take the March 2020 low and the August 2020 peak, 172 would be about a 38.2 retracement between those two extremes. If you instead use the August 2020 high and the March 2021 low, 38.2% of the way back up would give you just above 171. So 171-172 seems to be an important price level given the price extremes over the last two years. Notice how the peaks in May, July, August and September of this year have all been in that range, indicated with a pink shaded area on the chart. So while the price relationships makes sense based on Fibonacci retracements, the real challenge for GLD is the failure to break above that level in September. Until the price can reach above 172.50, confirming a break above Fibonacci and price resistance, the chart remains in a bearish phase.
Finally, we have the RSI at the very bottom of the chart. Since the price peak around 179 in June, the RSI has become oversold during down thrusts and has failed to get above the 60 level on upswings. In bearish market phases, the RSI tends to be unable to get above the 60 level as the entire RSI range moves lower. Until the RSI breaks above 60, this momentum indicator is confirming a bearish phase for gold.
So what would it take to turn this bearish assessment more bullish? As always, I find a checklist to be a simple way to lay out the steps and follow if and when they are triggered. So here goes:
1. GLD makes a higher low.
We may be forming the right shoulder of an inverted head-and-shoulder pattern and the current downswing would have to end above the 161 level. That could indicate an influx of buying power and potentially propel gold to new swing highs.
2. Price gets above 172 and stays there.
Charles Dow tells us that a downtrend is a pattern of lower lows and lower highs. By breaking above 172, the GLD would break that pattern and demonstrate that buyers are willing push the price to new swing highs.
3. RSI reaches above 60 on an upswing.
As long as the RSI remains below 60, the momentum picture will remain bearish. A rally in gold that pushes the RSI above 60 could indicate a rotation to a more bullish outlook.
There are many narratives, both bullish and bearish, related to gold and its importance as an inflation hedge, as a safe haven, even just as a store of value. In the end, none of that matters! Price will tell you most of what you need to know about gold's potential to outperform and its potential benefits to a well-rounded portfolio.
Want to digest this article in video format? Check out my YouTube channel!
RR#6,
Dave
P.S. Ready to upgrade your investment process? Check out my free course on behavioral investing!
David Keller, CMT
Chief Market Strategist
StockCharts.com
Disclaimer: This blog is for educational purposes only and should not be construed as financial advice. The ideas and strategies should never be used without first assessing your own personal and financial situation, or without consulting a financial professional.
The author does hold a position in GLD at the time of publication. Any opinions expressed herein are solely those of the author and do not in any way represent the views or opinions of any other person or entity.


