Investors often think of the FAANG stocks as one basket of names. Either the mega cap tech and communication trade is working, or it isn't. But, as a review of the charts will reveal, these stocks can actually be differentiated using their price and relative profiles.
So which of the FAANG stocks is best poised to outperform through the end of 2021?
(I should note that from here on out, I'll refer to this group of stocks as the FANMAG stocks: FB, AMZN, NFLX, MSFT, AAPL and GOOGL. Plenty of names could be included on this list, including TSLA, TWTR or even some of the China internet names, but I feel this is a good representative list.)
First, let's look at the price behavior of the six stocks.
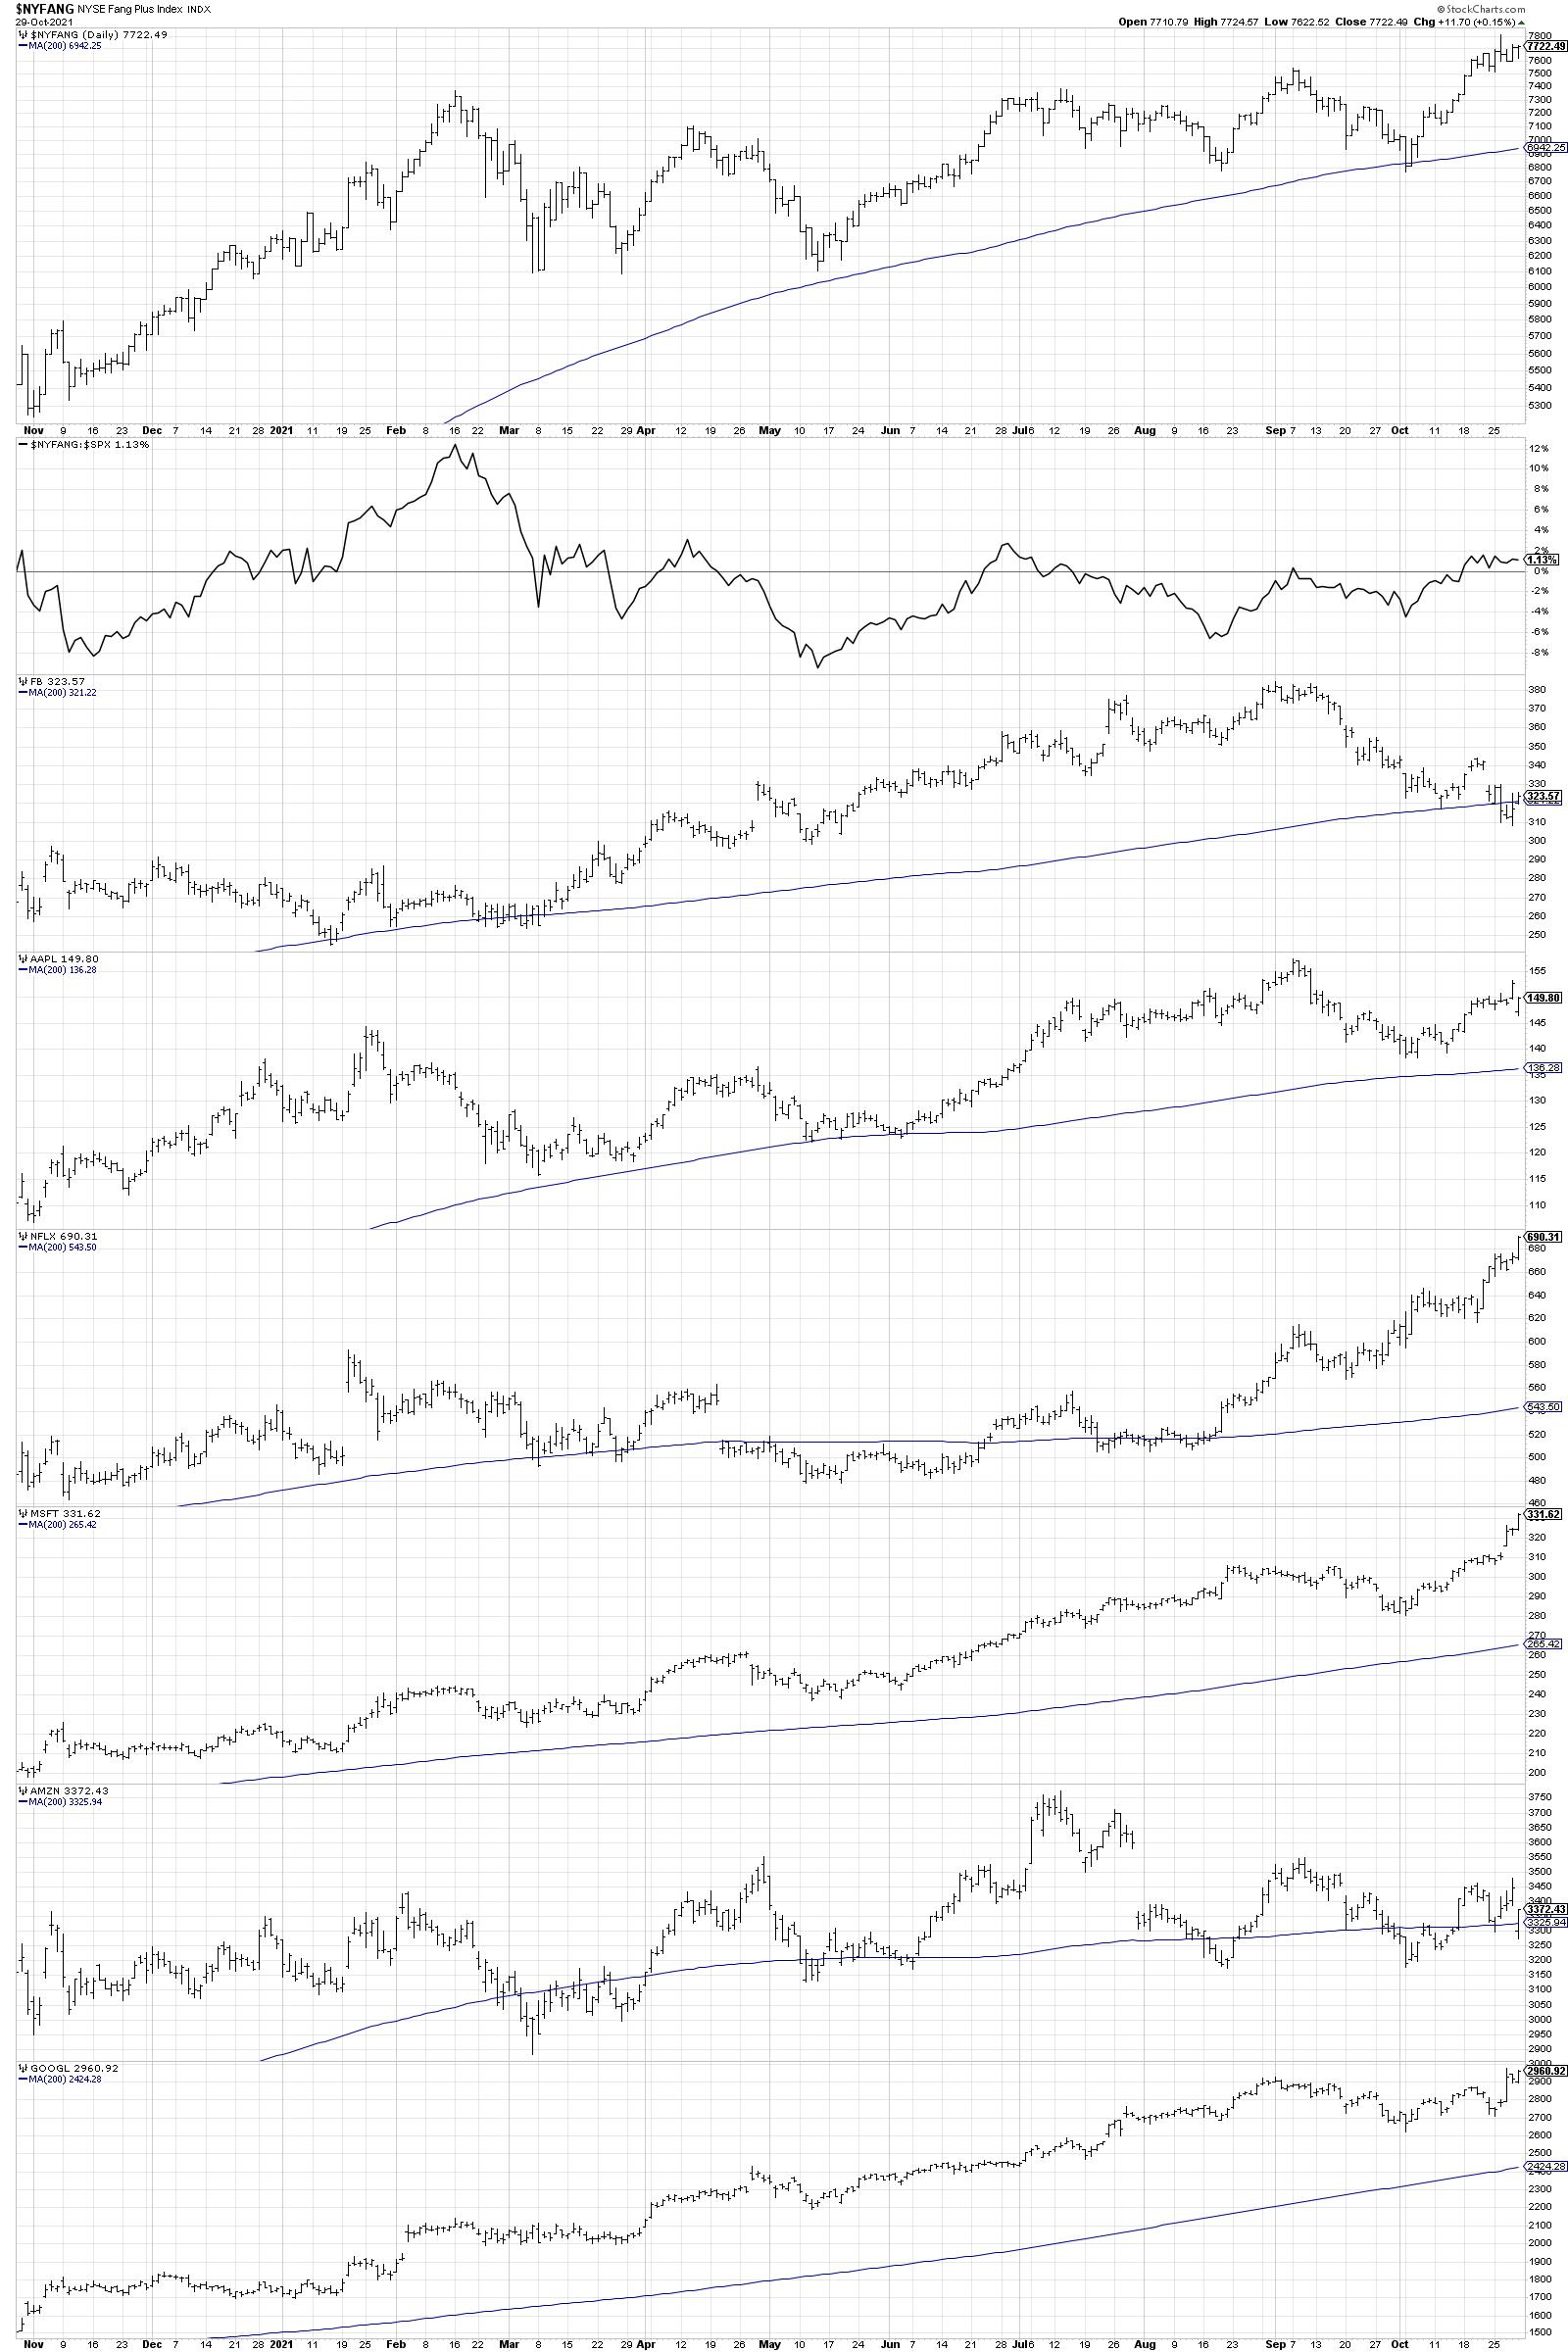
At the top, we are looking at the NYSE Fang Plus Index, which includes a number of FAANG and "FAANG-like" stocks including TWTR. You can see that the index is making consistently higher highs and higher lows over the last six months, which is the sign of a strong uptrend.
The second panel down shows the relative strength of this index (we'll get more into relative strength signals later!), which illustrates that the index has essentially been a market performer over the last 12 months. That is, your return for owning this index would have been about the same as owning the S&P 500 index.
Now we have the six FANMAG stocks showing their individual price bars for the last 12 months. Note how the first three data series have very different paths in the last six months! Let's review them all.

FB was in a consistent uptrend through early September, but has since broken down through its 200-day moving average (the only of the six names to do so). Next is AAPL, which had a choppy week around Thursday's earnings release and is rangebound between $138 and $157. Then we have NFLX, which was in a sideways consolidation pattern for the first two thirds of the chart, and then rotated higher to break out of the base en route to new all-time highs this week.
Clearly these stocks are on three very different paths! The chart is either bullish with a new all-time high, rangebound with clear support and resistance levels or breaking down through support and failing to hold the 200-day moving average. This is not a homogenous group of names with similar price patterns, as has often been assumed.
The next three charts reveal that MSFT and GOOGL have also made new highs this week, although Microsoft is much more extended than Alphabet. Finally, AMZN is in a consolidation pattern of lower highs and higher lows. Next steps here are uncertain, as price lacks upside or downside momentum.
Now let's take a look at the relative strength of these six names.
Our second chart begins with the ratio of the NYSE Fang Plus Index versus the S&P 500 Index. Then we have the six stocks, in a different order, showing the relative performance of each name versus the S&P 500 ETF.
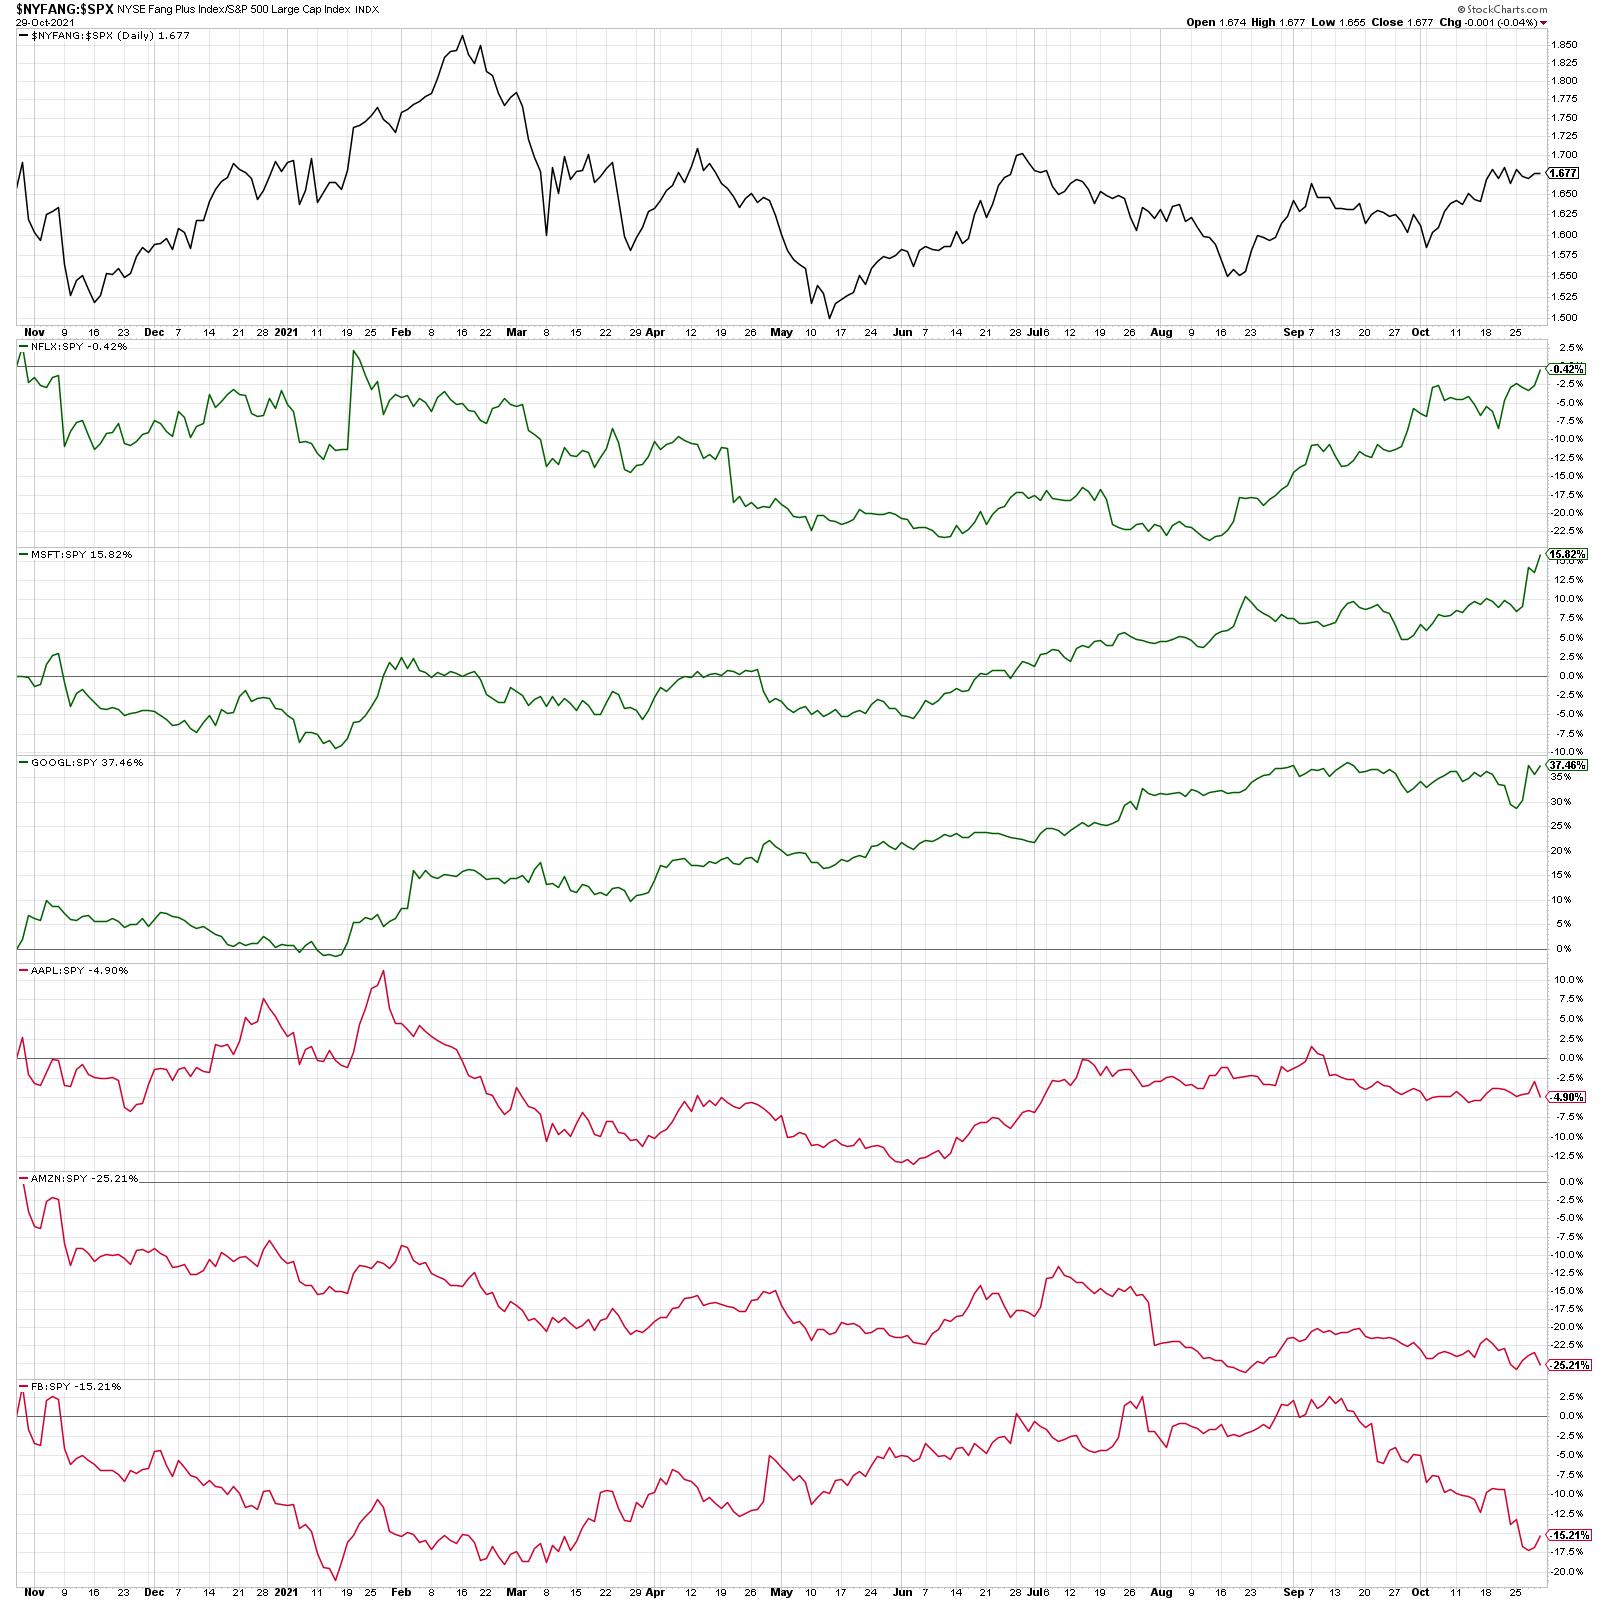
Now I've grouped these names into buckets: outperformers and underperformers. In the first bucket we have NFLX, MSFT and GOOGL. These are three names making new relative highs this week, or, in the case of Alphabet, very close to doing so.
Technical analyst John Roque used to ask, "If you're managing the Red Sox and you're trying to beat the Yankees, would you put your best players on the field?" Putting our best players into our portfolios gives us the best chance to outperform, and that means names demonstrating strong relative strength!
The next three stocks - AAPL, AMZN and FB - are all showing negative relative strength trends, with all three near new relative lows this week. One of the best ways to consistently underperform the S&P 500 is to own stocks where the relative lines are going down! So that leads us to the most important question: Which of these six names is best poised to outperform through year end?
I would have to start with the three outperformers - NFLX, MSFT and GOOGL. MSFT is tempting because it has been a consistent outperformer with a proven history of generating positive returns. However, I'd consider this the most overextended of the six names with profit taking a real possibility. So MSFT is out. GOOGL is also quite tempting, and I think the recent pullback in September means that a new group of buyers likely came in to push the price back to test all-time highs.
But I would have to go with Netflix. What most impresses me about this chart is the 13-month basing pattern, where the chart was sideways from July 2020 through August 2021. Then something different happened. The break to new highs in September, followed by a pullback the breakout level and upside reversal, suggested a new accumulation phase. The relative strength was negative for the first six months of this year, but has now turned higher as the stock has made successive new highs.
Remember that even if stocks tend to be grouped together based on their business models or sectors, that does not mean they will have the same performance characteristics. A deeper dive into price and relative strength can be a fantastic way to differentiate names and identify opportunities!
To digest this article in video format, here are two to review. The first one discusses the price patterns of these six names, while the second goes into more detail on their relative strength characteristics.
RR#6,
Dave
P.S. Ready to upgrade your investment process? Check out my free course on behavioral investing!
David Keller, CMT
Chief Market Strategist
StockCharts.com
Disclaimer: This blog is for educational purposes only and should not be construed as financial advice. The ideas and strategies should never be used without first assessing your own personal and financial situation, or without consulting a financial professional.
The author does not have a position in mentioned securities at the time of publication. Any opinions expressed herein are solely those of the author, and do not in any way represent the views or opinions of any other person or entity.


