The worst crime that an analyst can commit is remaining bearish in the face of a rising market. -Richard Russell
The S&P 500 has now round tripped from its early September high around 4550 and the low around 4300 in early October. Will there be enough buying power next week and beyond to propel the index beyond 4550 to further new highs?
My mentors in the financial industry would tell me to focus on the chart of the S&P 500. Or to speak more broadly, focus on price. Price will tell you most of what you need to know about any financial asset.
But for indexes like the S&P 500, we can look "under the hood" and analyze market breadth indicators. Breadth speaks to participation. If the index is doing one thing, what about the hundreds of stocks that comprise that index?
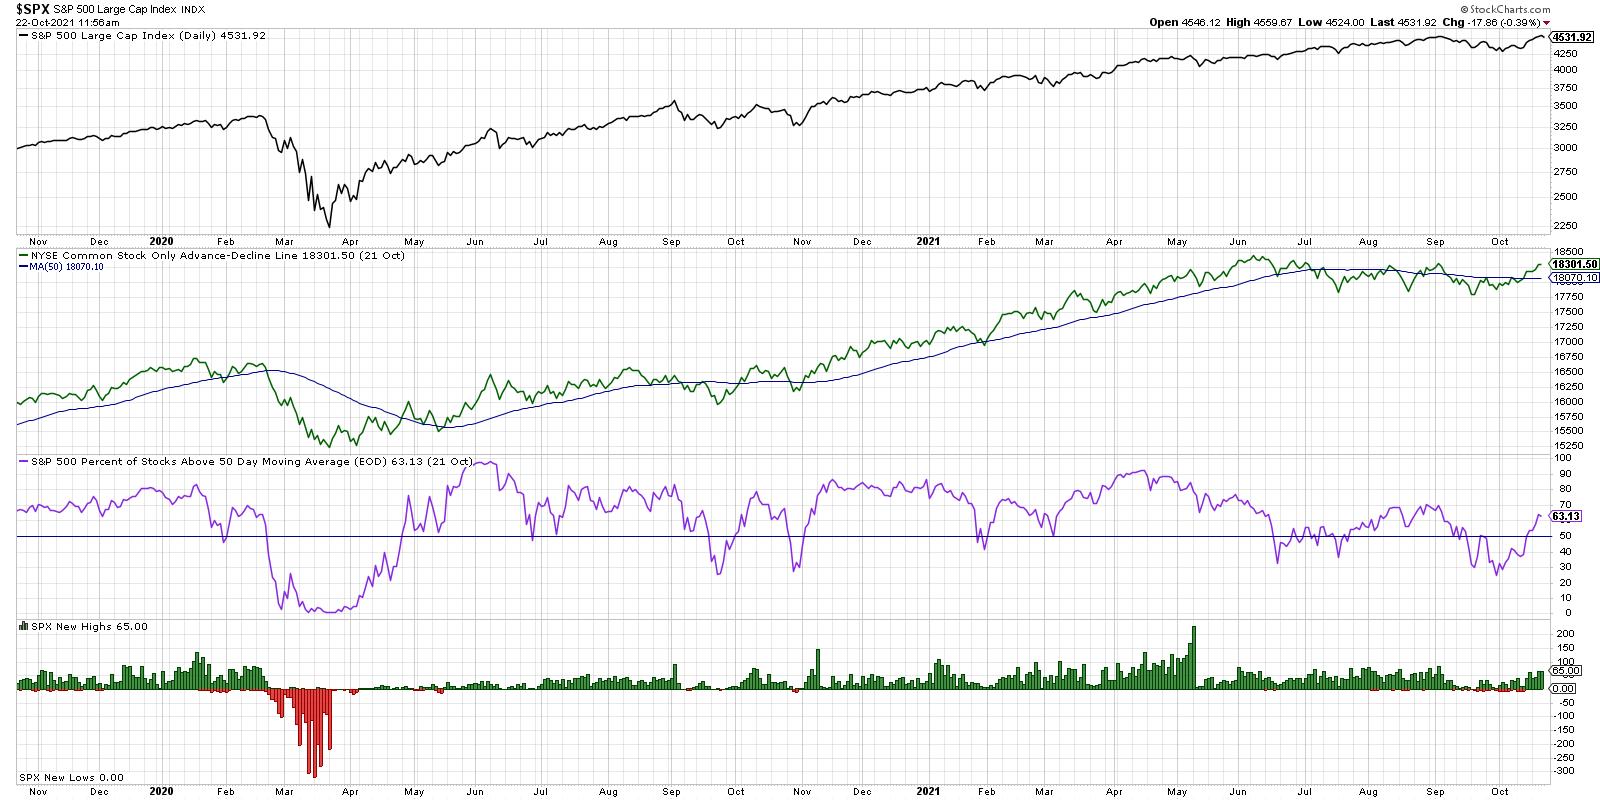
From the top, we have the S&P 500 on a closing basis testing all-time highs from early September. Let's be clear. As Paul Montgomery used to say, "The most bullish thing the market can do is go up." Having said that, let's go through each breadth indicator and see what we can conclude.
The second panel down in green is the cumulative advance-decline line for the NYSE using only common stocks. This is also testing the September high, and a break above this level would certainly seem to confirm that the current rally is part of a broader advance. The more stocks that close higher, the more this line will reflect that by pushing higher as well.
Next in purple we have the percent of S&P 500 names above their 50-day moving average. This was down to around 25% in late September, and now has rotated to over 64%. That means about 40% of S&P 500 members, about 200 names, have rotated back above their 50-day moving average so far in October.
In a healthy bull market phase, this indicator tends to remain above 50% which tells us that over of the stocks in the index are above this trend-following mechanism. When the market goes higher, and this indicator does not confirm that up move, it's time to get skeptical.
Finally, we have the number of new 52-week highs and lows for the S&P 500. A healthy bull market phase involves an expansion in new highs. For the S&P to go materially higher than present levels, you would need to see an increasing number of new highs. The more stocks like HD and UNP and NFLX break out, the more likely the S&P 500 index is to do the same.
Is market breadth confirming this new bull market phase or not? At this point, the results are inconclusive. But this is one chart I'll be watching in the coming weeks to make that determination. More color and details in the video below!
RR#6,
Dave
PS- Ready to upgrade your investment process? Check out my free course on behavioral investing!
David Keller, CMT
Chief Market Strategist
StockCharts.com
Disclaimer: This blog is for educational purposes only and should not be construed as financial advice. The ideas and strategies should never be used without first assessing your own personal and financial situation, or without consulting a financial professional.
The author does not have a position in mentioned securities at the time of publication. Any opinions expressed herein are solely those of the author, and do not in any way represent the views or opinions of any other person or entity.


