In early October, market trends appeared to make sense—at least, as much as could be expected in 2022. The S&P 500 Index ($SPX) had just made a new 52-week low, the U.S. dollar had just achieved a new 52-week high, and the 10-Year Treasury yield had just reached its highest level since 2008.
And then everything changed.
Over the last six weeks, equities have rallied, with $SPX testing its 200-day moving average from below. The U.S. dollar has rotated lower, closing below its own 200-day moving average this week for the first time since June 2021. Interest rates have moved significantly lower, with the 10-year now 75 basis points (bps) lower than its October peak of around 4.25%.
This mean reversion move has left many investors scrambling to determine how to play the remainder of 2022. Will stocks follow their traditional path of strength in December, known as the strongest month for equities? Or will $SPX and the Nasdaq Composite ($COMPQ) buck that trend and show weakness, indicating that the November rally was overly excessive?
Today, I'll present three trendlines I'm watching to answer those questions in the coming weeks. First, let's review the S&P 500 index and its fairly orderly decline in 2022.
1. S&P 500 Index
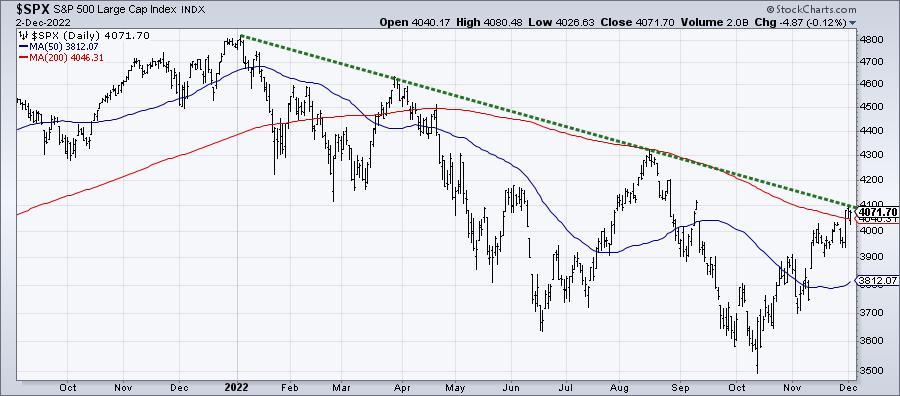
CHART 1: S&P 500 INDEX ($SPX) HITS TRENDLINE RESISTANCE. The trendline in $SPX is at around 4100. If $SPX breaks above the trendline, the next resistance is at its August high of around 4300. Chart source: StockCharts.com. For illustrative purposes only.
If you connect the major peaks in 2022—the ones in January, March, and August—you'll see that it lines up almost perfectly with this week's high. This key trendline currently lies right around 4100, which represents the final clear level of resistance around current levels. If and when $SPX breaks above this trendline, a move to the August high around 4300 would be the next logical step. This 4300 level, coincidentally, represents a 61.8% Fibonacci retracement of the January to October selloff.
Next, we have the U.S. dollar.
2. U.S. Dollar Index
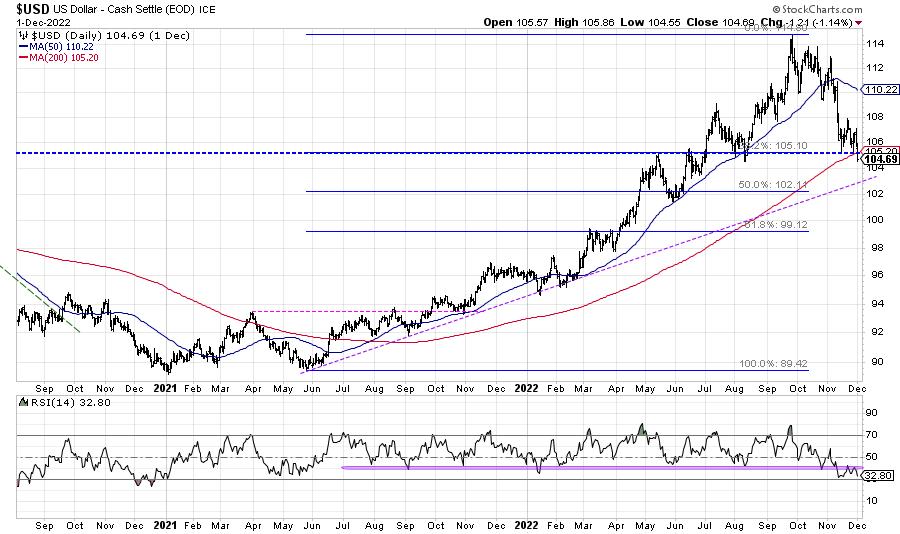
CHART 2: U.S. DOLLAR INDEX ($USD) BATTLING WITH HORIZONTAL TRENDLINE. If $USD breaks below the horizontal trendline, the next resistance level could be trendline from the 2021 and 2022 lows (purple dashed line). Chart source: StockCharts.com. For illustrative purposes only.
The U.S. Dollar Index ($USD) has dropped from a peak just above 114 to end this week around 104. Here, we have a horizontal trendline (blue dashed line) which is a 38.2% Fibonacci retracement of the 2021–2022 uptrend. This trendline also lines up with the swing lows in August and November, as well as the 200-day moving average.
One of the major themes of 2022 has been the strength in the U.S. dollar, which is often called the "wrecking ball for risk assets". The recent weakness in $USD has allowed stocks, bonds, and commodities to all move higher over the last six weeks.
If you're bullish on stocks here, I'd be cheering for the U.S. dollar to move even lower. A trendline from the 2021 and 2022 lows may be a good downside objective, currently around 103.
Finally, we can look at India.
3. iShares MSCI India ETF
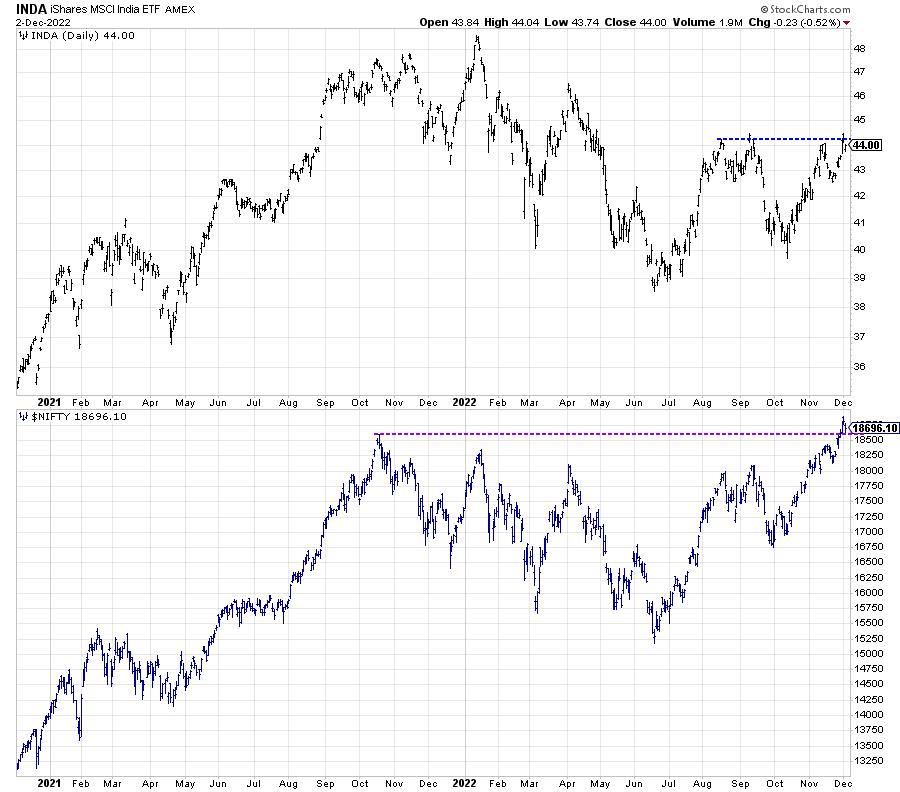
CHART 3: INDIAN STOCK MARKET SHOWING STRENGTH. The iShares MSCI India ETF (INDA) is well below its high even though the benchmark indexes NIFTY 50 ($NIFTY) and the Sensex are at their highs. The difference is due to the strength of the U.S. dollar. The bigger question is will INDA and the indexes break their resistance levels?Chart source: StockCharts.com. For illustrative purposes only.
When I traveled to Mumbai last month, I spent a good deal of time reviewing charts in local currency, including the NIFTY 50 and the Sensex. These indexes broke to new 52-week highs this week, as the Indian market has shown renewed strength. But the U.S.-listed ETF to play India, INDA, is about 10% below its own 52-week high. What's the reason for such a difference between the two charts? It's the impact of the U.S. dollar.
The strength in $USD through most of 2022 has meant that, for American investors, going outside the U.S. stock market has been unfavorable as any strength in the local market would be deteriorated by the currency differential. The recent drop in the dollar has completely flipped that narrative. While INDA is still well off its January high, the price is testing resistance just above $44 which, if broken, would complete a head-and-shoulders continuation pattern.
I'll be watching these trendlines for INDA (blue) and $NIFTY (purple) to see if these resistance levels can be broken and held.
Trendlines can provide an effective way to define trends, follow their progress, and then identify when the trends have shifted. Those are three of the many trendlines I'll be following next week, to determine whether December continues the risk-on phase the markets have experienced since October.
Want to see a deeper dive into today's first chart of $SPX? Just head over to my YouTube channel.
RR#6,
Dave
P.S. Ready to upgrade your investment process? Check out my YouTube channel!
David Keller, CMT
Chief Market Strategist
StockCharts.com
Disclaimer: This blog is for educational purposes only and should not be construed as financial advice. The ideas and strategies should never be used without first assessing your own personal and financial situation, or without consulting a financial professional.
The author does not have a position in mentioned securities at the time of publication. Any opinions expressed herein are solely those of the author, and do not in any way represent the views or opinions of any other person or entity.


