People absolutely love to not love gold. When I post bullish gold comments on social media, I am guaranteed to get some not-so-constructive pushback on an optimistic thesis.
Why do people love to hate the gold trade? Well, for starters, it hasn't worked in a long time. But that all may be changing in 2023.
The Long-Term Struggles of the Yellow Metal
Investors have a great long-term memory of painful investment experiences. And that gold performed so abysmally from 2011–2018 certainly didn't win over any investors looking for long-term gains.
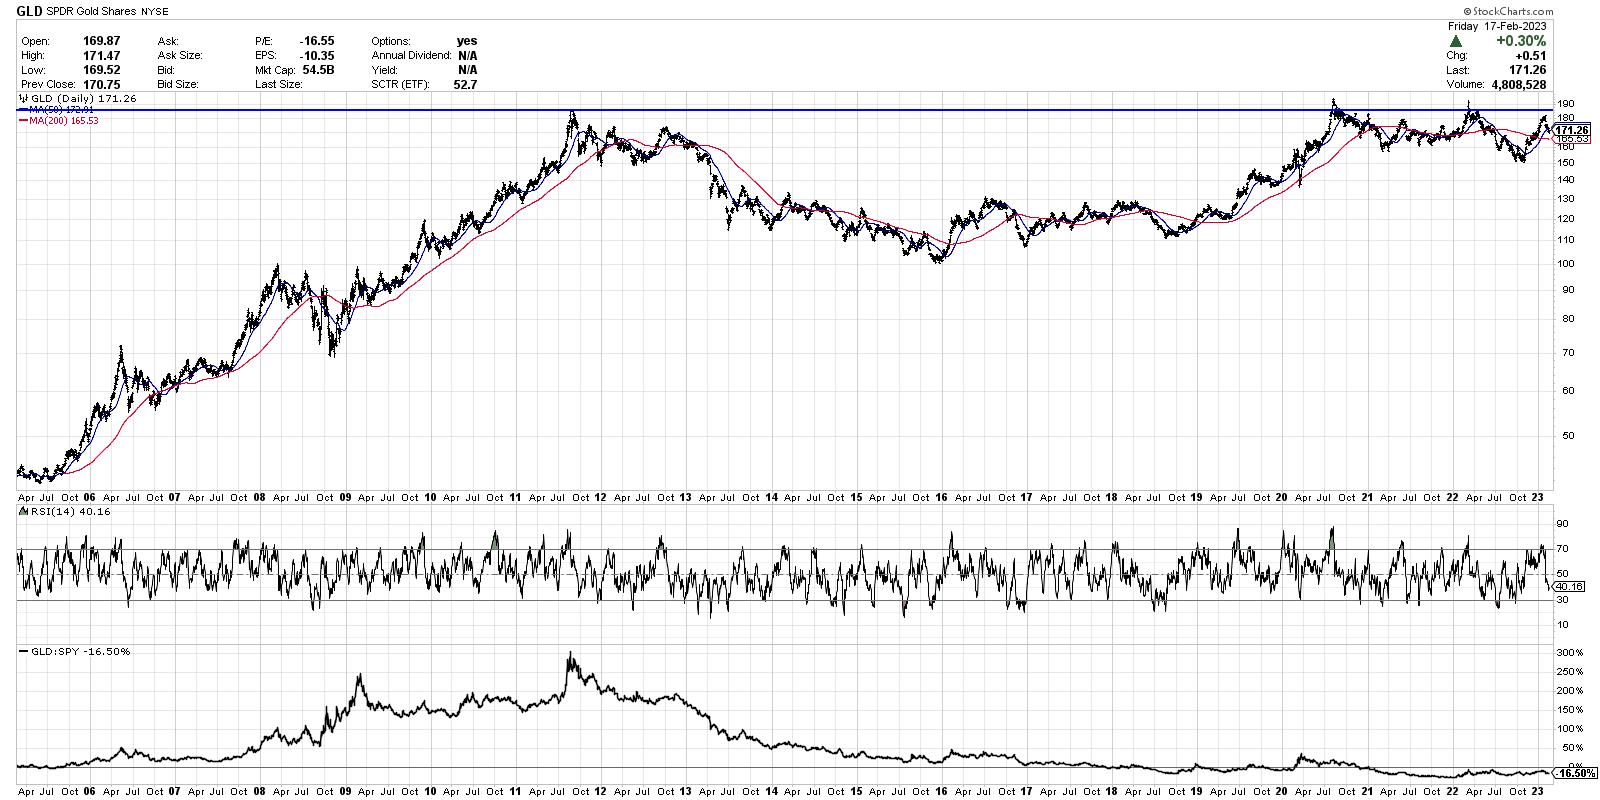
Here, we're looking at the SPDR Gold Shares ETF (GLD) which shows a peak in 2011 around $185. Note how gold struggled through the mid-2010s, as the S&P 500 and Nasdaq were basically in the middle innings of a cyclical bull market phase.
At the bottom of the chart, we have the relative performance of GLD versus SPDR S&P 500 ETF (SPY). By owning gold during this period, you were basically guaranteed to underperform, because you were allocated away from top-performing stocks and ETFs.
But From the Ashes Emerges Strength
Gold did fairly well in 2018–2019, with the GLD outperforming the S&P 500 index coming out of the 2018 lows. While gold held up pretty well during the early days of the COVID era, stocks outperformed the yellow metal through the course of 2020 and 2021.
Are you ready for a deep dive into breadth indicators? In our latest FREE webcast on Tuesday February 21, we'll show you how they're constructed, how they generate buy and sell signals, and what they're telling us about the current markets. Sign up HERE for this free event, Five Favorite Breadth Indicators!
GLD ended up testing resistance around $185 in 2020 and again in early 2022, further solidifying the importance of this upside price objective. This coincides with about $2000/oz on the chart of spot gold. How bullish do you want to be on gold if it can't get above resistance?
But do you notice the cup-and-handle pattern that has played out over the last 10–11 years? That's where you have a long rounded bottoming pattern, a retest of the resistance level forming the right side of the cup, and finally a shallower pullback to create the handle.
This emerging pattern suggests a long-term base with strong upside potential, but if and only if the price can break above and follow-through beyond this resistance level. If that were to occur, the height of the pattern suggests an upside target around $344, which would equate to around $3700/oz for spot gold.
Connecting the Short-Term to the Long-Term
Now let's review what's happened so far in 2023. Gold spent most of 2022 in a bearish momentum phase, with the relative strength index (RSI) ranging from oversold on downswings to only 60 on upswings. This is classic behavior for a downtrend phase. But something changed in the fourth quarter, just as we saw for equities.
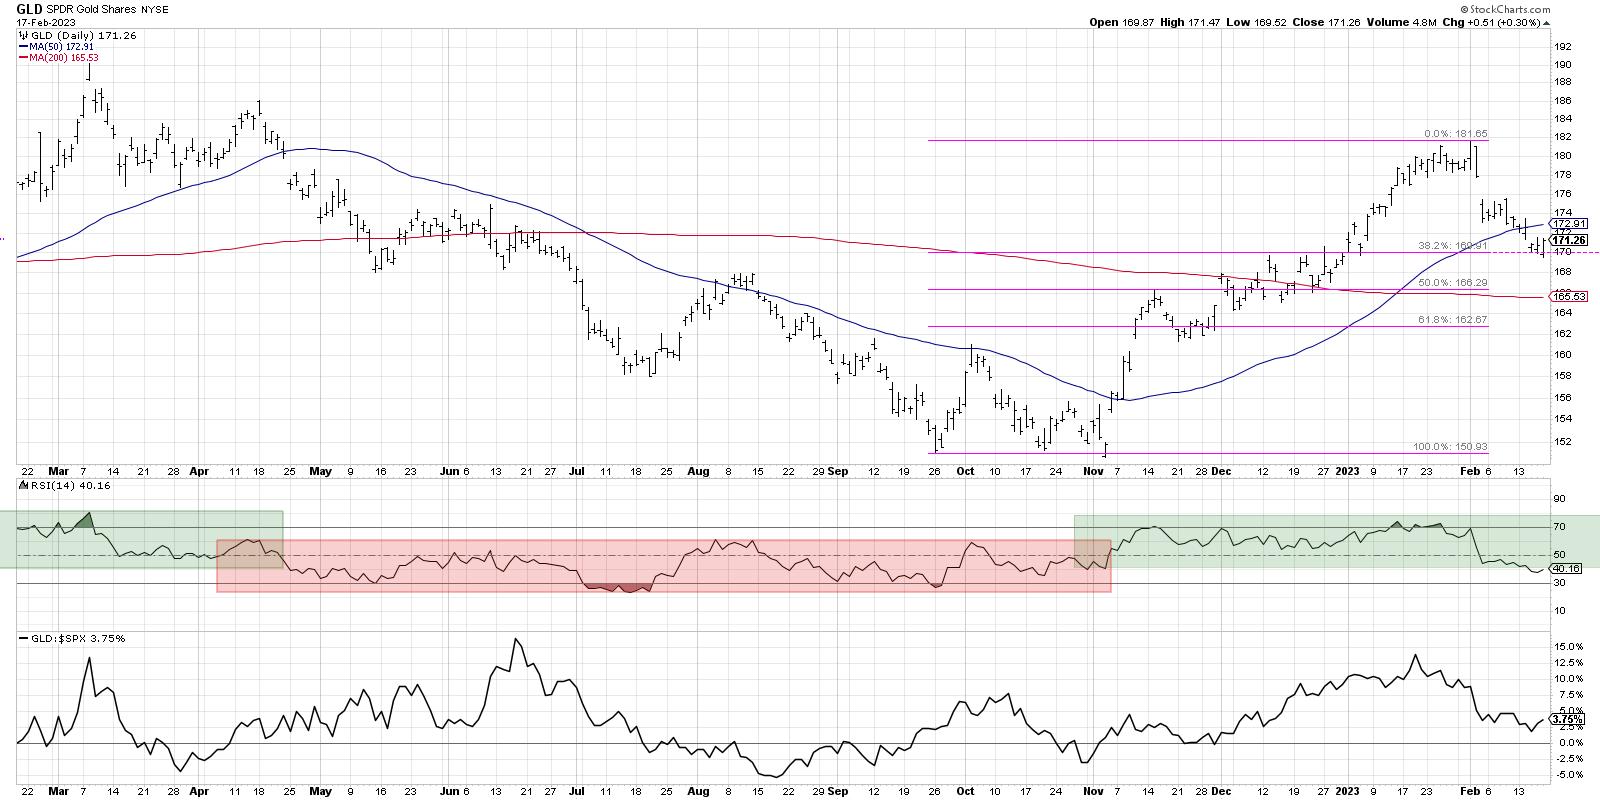
In November, GLD broke to a new swing high and the RSI finally pushed above 60 to reach the overbought level around 70. This influx of positive momentum suggested a "change of character," or a rotation from distribution to accumulation phase.
After testing $182 at the end of January, GLD has now pulled back to retrace about 38.2% of the way back down to the October 2022 low. While gold did break below its 50-day moving average (which is less than ideal), I'm encouraged by the fact that the price has so far held the first Fibonacci retracement level, with the RSI remaining just above 40.
In the short-term, if you assume downside risk to the 200-day moving average around 165.50, that would mean about a 2.5 to 1 risk/reward if you expect a retest of the January peak.
Given the uncertainty in the equity markets, the big unknown in terms of the schedule of Fed rate hikes, and the weakness in growth names this week, perhaps gold deserves a second look as a hedge against further downside for stocks.
Did you miss my latest YouTube video analyzing a chart like NVDA to identify potential entry points? I got you covered.
RR#6,
Dave
P.S. Ready to upgrade your investment process? Check out my free behavioral investing course!
David Keller, CMT
Chief Market Strategist
StockCharts.com
Disclaimer: This blog is for educational purposes only and should not be construed as financial advice. The ideas and strategies should never be used without first assessing your own personal and financial situation, or without consulting a financial professional.
The author does not have a position in mentioned securities at the time of publication. Any opinions expressed herein are solely those of the author and do not in any way represent the views or opinions of any other person or entity.


