The major equity averages have stalled out in recent weeks, trading up to their February highs but unable to muster enough positive momentum to push to new swing highs.
The key question as we continue through earnings season is whether there will arise a catalyst to propel the S&P 500 above 4200. But while we wait for this bullish indication, three charts tell me that the more likely scenario is a pullback from current levels.
McClellan Oscillator Suggests Weakened Breadth
One of the main bullet points for bears in 2023 has been a lack of participation. This has been a narrow-led rally dominated by mega-cap growth stocks. How can the market uptrend be sustained without stronger breadth readings?
Breadth indicators like the McClellan Oscillator started to turn bullish in late March, telling us to believe in the upward market trend as the participation was widening. Now this indicator has turned back negative, suggesting that a downside move is likely.
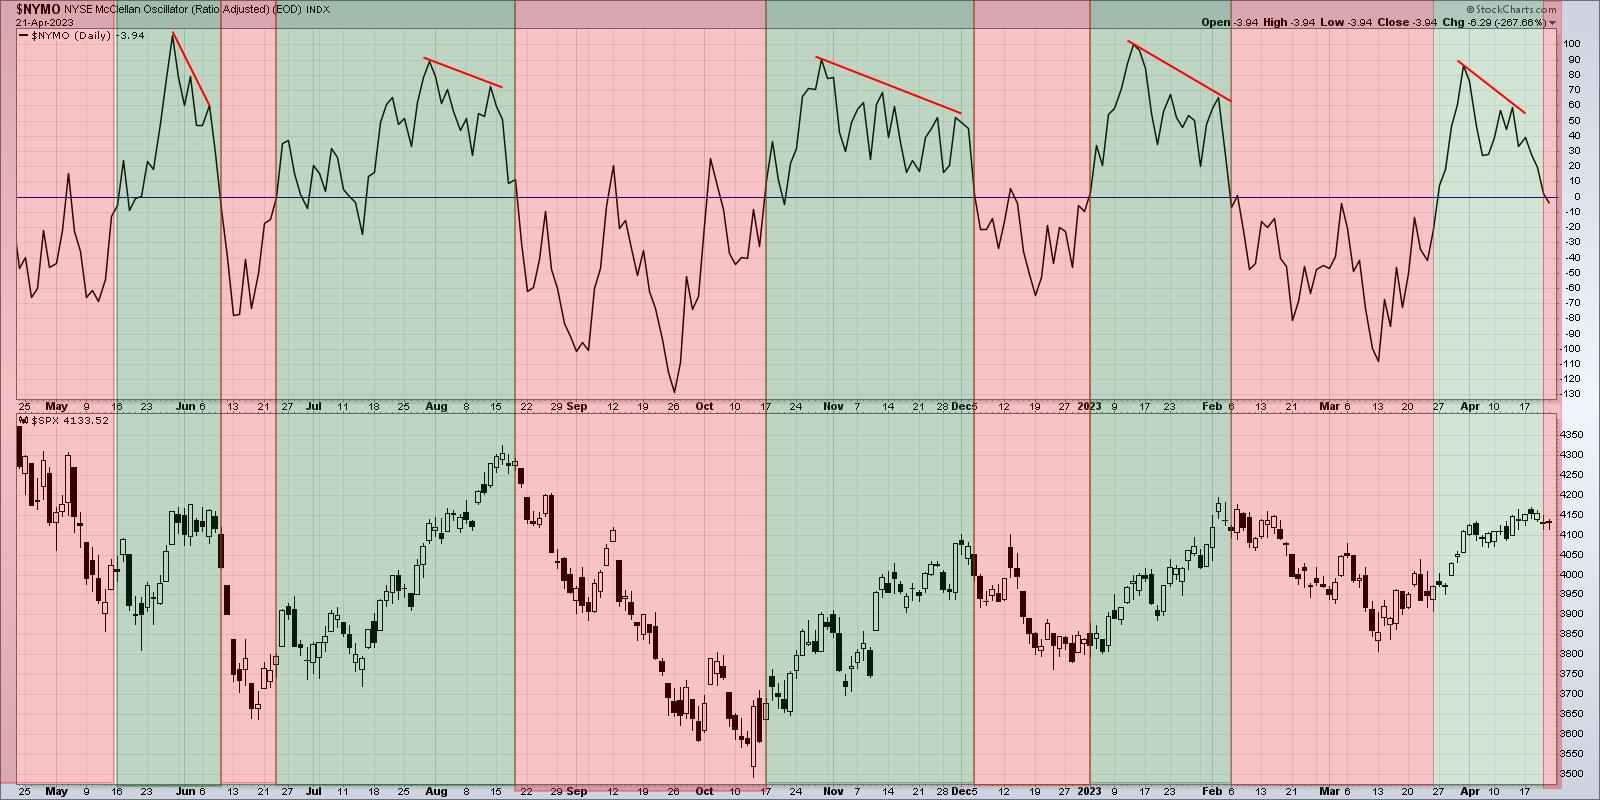
Notice that the McClellan Oscillator often moves back below zero pretty early in market pullbacks. The three most recent signals led to pullbacks of about 4-14% and last four to eight weeks. While that is no guarantee that we see a pullback next week, it certainly suggests that is a strong possibility!
Amazon Tests Its 200-Day Moving Average
Amazon (AMZN) broke down through its 200-day moving average in December 2021, after testing this long-term barometer as support numerous times earlier that year. Rallies in May 2022, August 2022, and February 2023 all failed right at the 200-day moving average.
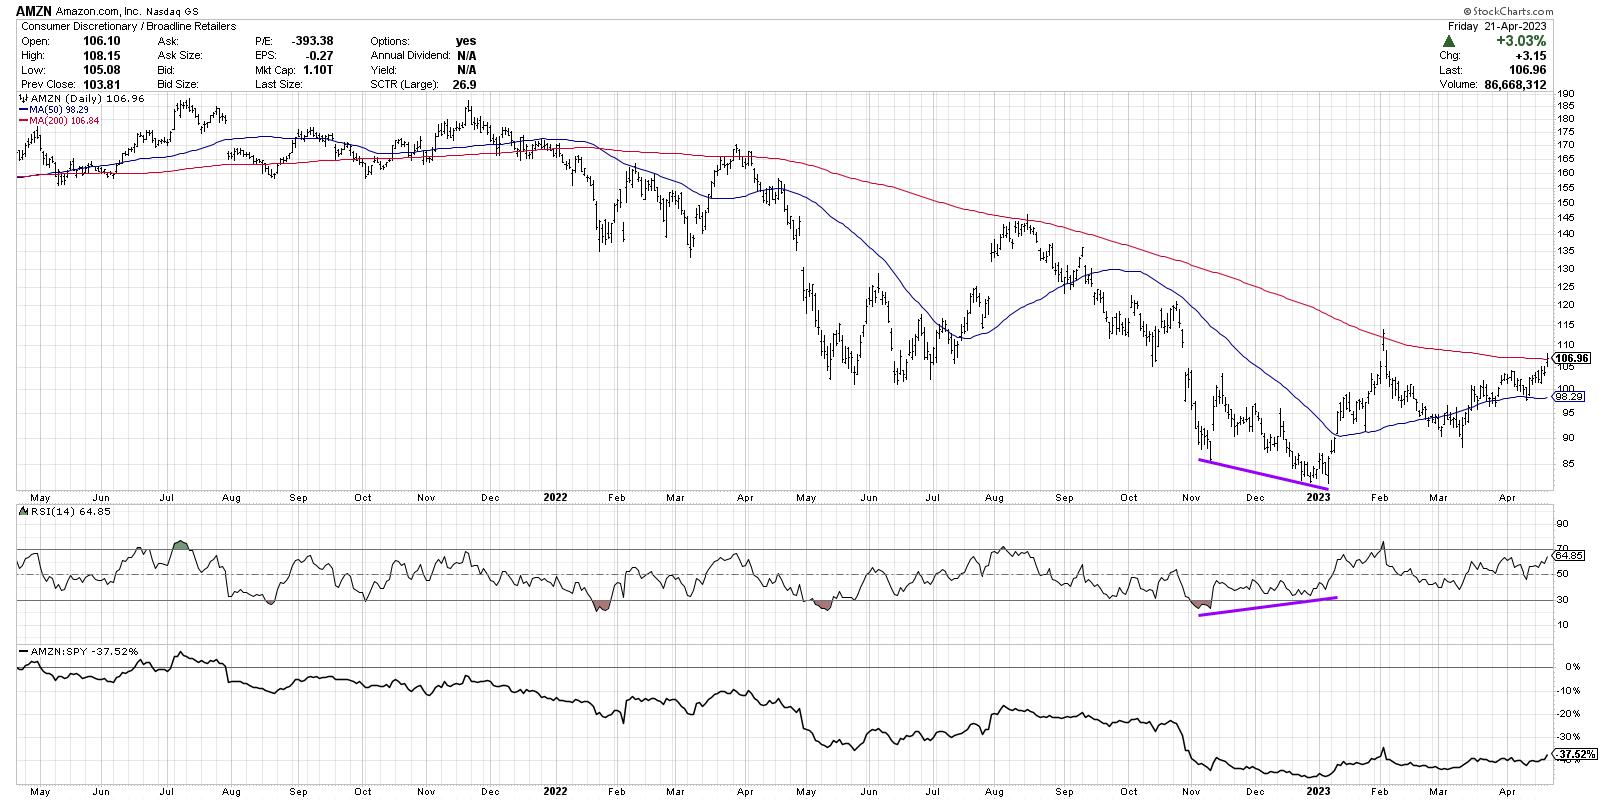
What's interesting more recently is the higher low last month. Just like the S&P 500, AMZN established a higher low before the current rally phase. Could this finally be the time when Amazon is able to power through this key resistance level?
I remain skeptical, because I tend to believe that a trend will continue until proven otherwise. So until we get the confirmed breakout, it's nothing but a downtrend. But a move above the 200-day would certainly provide a boost to the Consumer Discretionary ETF (XLY), as well as the broad market as a whole.
3. TSLA Confirms a Bearish Rotation
So let me start this section by pointing out that yes, I understand that market can rally just fine without Tesla (TSLA). But hear me out.
I think of Tesla in a similar way that I think about the ARK Innovation Fund (ARKK) or even Bitcoin. These represent a play on general speculation. The COVID era saw a huge influx of novice investors, many of which focused on these themes of emerging growth and promising new technologies.
So I would say that a more sustainable bull market phase may need to include things like TSLA and ARKK to demonstrate that this cohort of investors is once again putting bets on emerging growth stories.
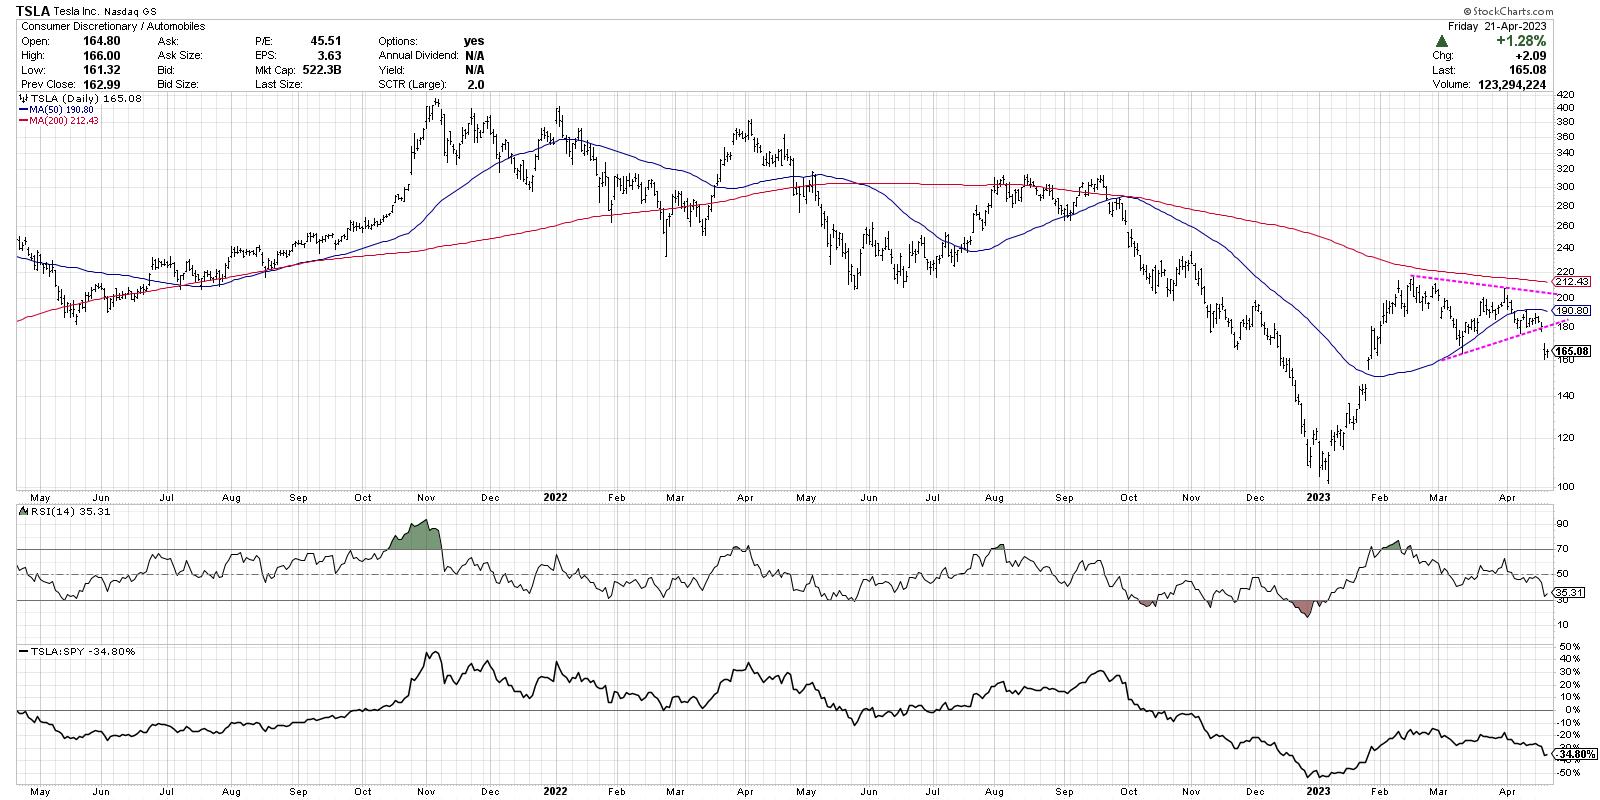
The chart is telling us that this groundswell of support from newer investors has not yet come to fruition. After peaking just below the 200-day moving average in February, Tesla has settled into a coil pattern of lower highs and higher lows.
Basically, the price is rotating around an equilibrium level of about $190, implying that the market is an agreement of the value of the stock. A coil pattern at some point will resolve to the upside or downside, which would indicate a new shift in momentum and a likely continuation of the breakout.
The stock gapped lower Thursday after earnings disappointed following the close on Wednesday. This confirms a downside break of the coil pattern, suggesting further deterioration from current levels.
The McClellan Oscillator breaking below zero has been one of the most effective market indicators over the last 12 months. With this week's sell signal, we once again face a likely drawdown period.
Amazon could certainly break above its 200-day moving average next week, and Tesla could bounce right back to make a new high in May. But for now, these charts appear to confirm the short-term bear case, which means the S&P 500 may have to wait a bit longer to eclipse 4200.
One more thing...
My latest video covers the simple checklist I used to validate a recent uptrend in semiconductors. How does your checklist compare to mind? Check it out and let me know!
RR#6,
Dave
P.S. Ready to upgrade your investment process? Check out my free behavioral investing course!
David Keller, CMT
Chief Market Strategist
StockCharts.com
Disclaimer: This blog is for educational purposes only and should not be construed as financial advice. The ideas and strategies should never be used without first assessing your own personal and financial situation, or without consulting a financial professional.
The author does not have a position in mentioned securities at the time of publication. Any opinions expressed herein are solely those of the author and do not in any way represent the views or opinions of any other person or entity.


