RRG Charts October 27, 2014 at 12:11 PM

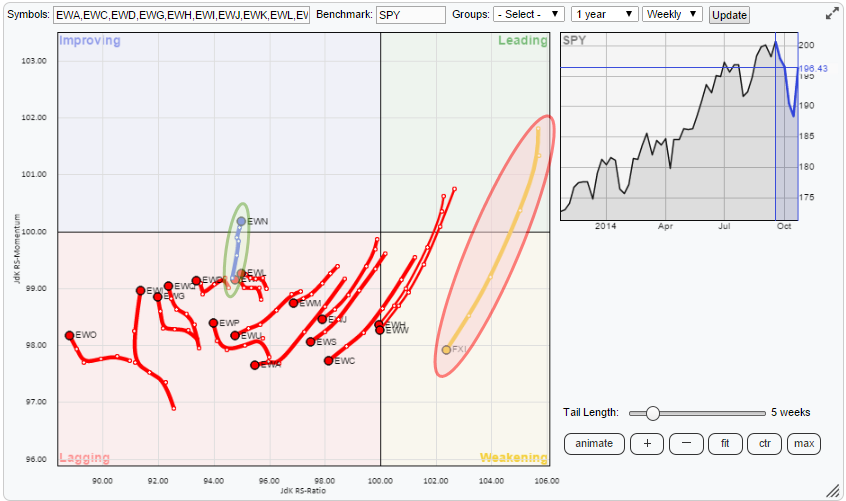
The landscape for international equities continues to show a rotation out of Emerging Markets into more developed markets. At least that is the big picture... Read More
RRG Charts October 20, 2014 at 05:09 AM

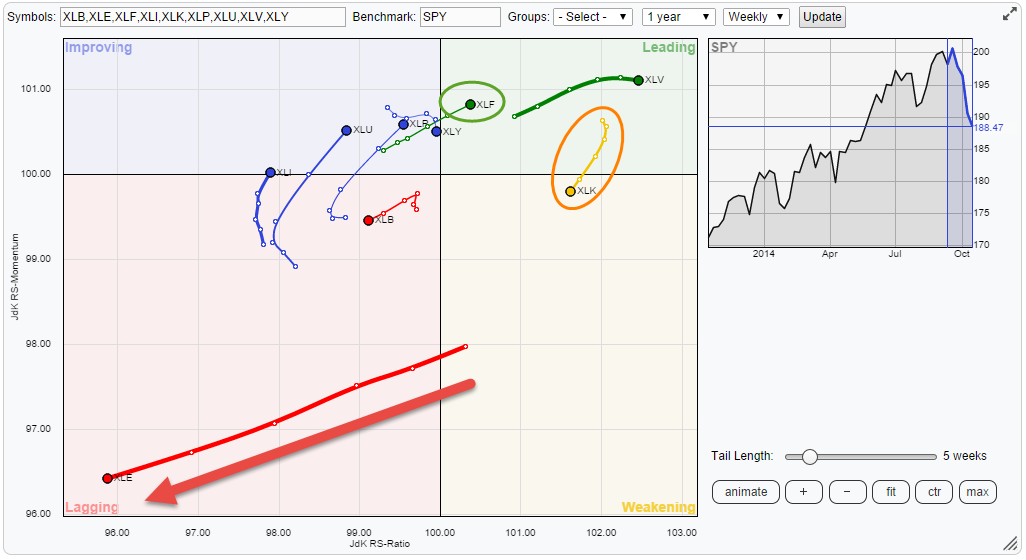
Printed below is the weekly Relative Rotation Graph(tm) of the nine S&P sector ETFs against SPY. The clear eye-catcher on this picture is the move of XLE (Energy) deep inside the lagging quadrant and still heading deeper into it... Read More
RRG Charts October 06, 2014 at 12:45 PM

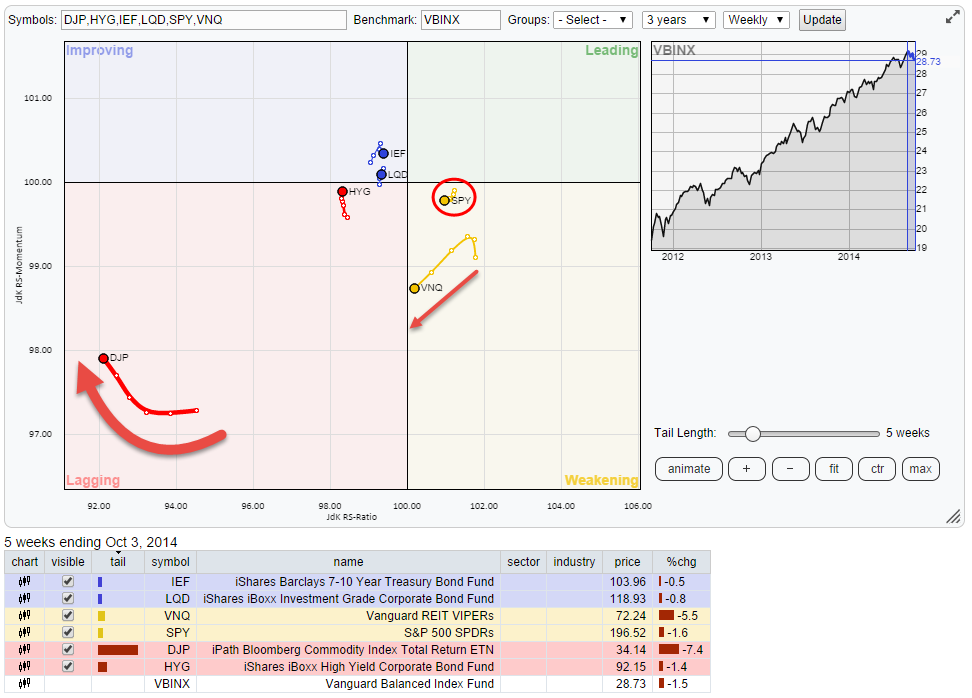
On the Relative Rotation Graph holding a number of, indices representing various, Asset Classes there are two that are standing out and deserve our attention. The first one is Commodities and the second one is Real-Estate... Read More