The relative rotation of various asset classes continues to tell the same story as it has been doing for quite a while now.
I could make this a very short article by just saying that the short version of this party line remains to be long or overweight real estate (listed stocks) and short or underweight commodities.
Such a view is backed by- and shown on the Relative Rotation Graph below, the chart holds a number of asset class ETFs and uses Vanguard Balanced Index Fund (VBINX) as its benchmark. But there is more to see than just Real Estate and Commodities.
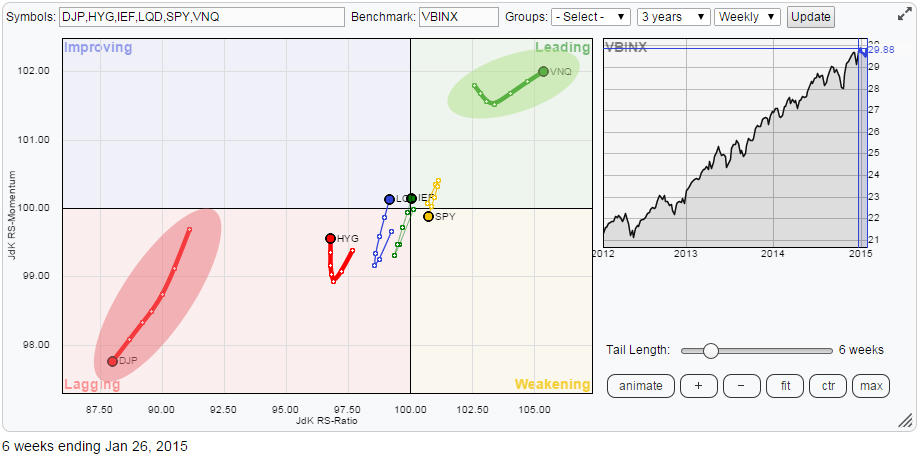
After a slight loss of relative momentum VNQ (real estate) has turned up again and continues to travel deeper into the leading quadrant. That relative up-trend is still fully intact. The same goes for DJP (commodities) in the opposite, lagging, quadrant. Over the past 6 weeks they have been steadily moving lower on both axes.
Vanguard REIT VIPERs (VNQ)
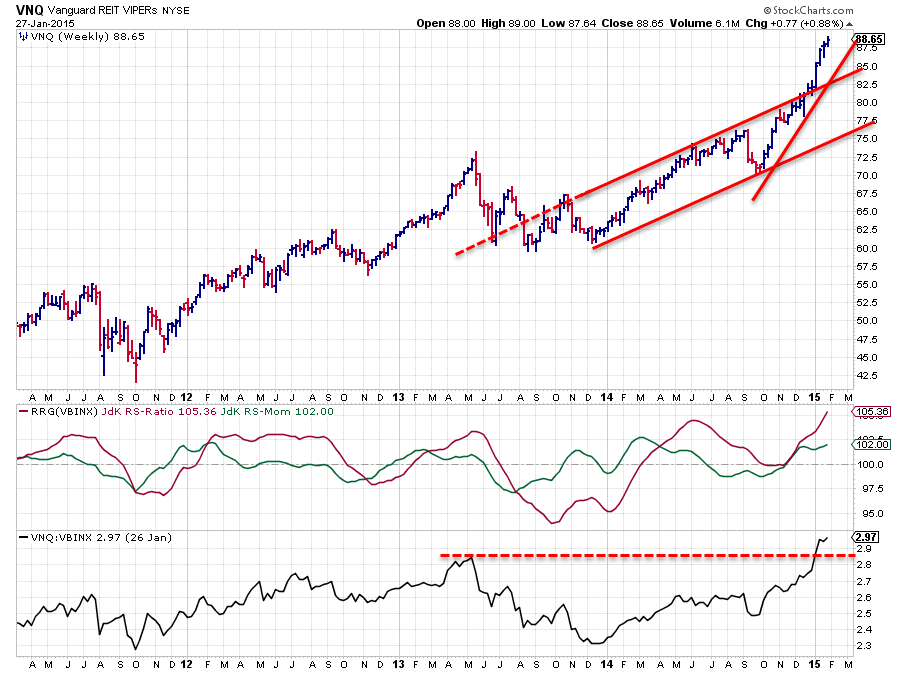
This chart looks very strong from both an absolute and a relative point of view. The up-trend in Relative Strength that started early last year is still in full swing and the break of the raw RS-line above the early 2013 high only confirms that strength.
The RRG Lines show a similar pattern. Early last year the JdK RS-Ratio crossed above the 100-mark indicating a relative up-trend. The loss of relative momentum after the initial move higher brought the RS-Ratio line close to the 100-level again but it did not cross and turned back up again. On a Relative Rotation Graph this will show a rotation that takes place fully on the right-hand (positive) side of the plot. Since November last year the JdK RS-Momentum line is once again pushing the RS-Ratio line higher and it is still doing so at this moment.
The price chart is showing an equally strong picture. A solid up-trend starting at the end of 2013, nicely captured between two parallel trend-lines and then at the beginning of this year an upward break out of this already rising channel. Usually a very strong sign. We are currently seeing the acceleration of prices higher as a result of this break and it looks as if the up-trend has started a new phase at an even steeper angle.
It is tempting to call the top on this one, or the moment at which relative strength will start to wane but it might be better to not buck this trend for the time being as there are no signs of weakness to be found anywhere yet.
iPath Bloomberg Commodity Index Total Return ETN (DJP)
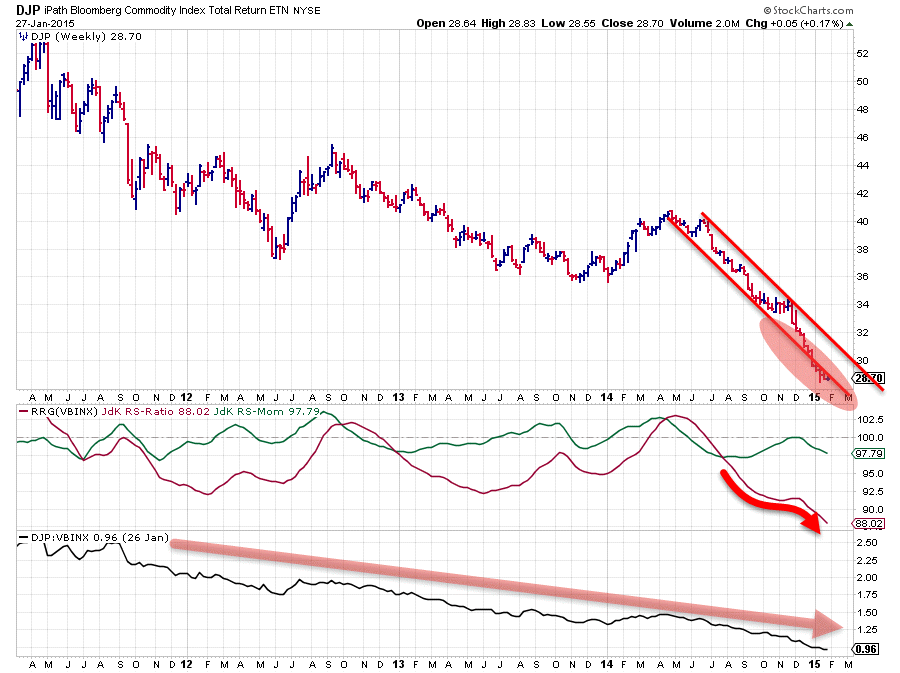
Three years and counting... Only one quick glance at the raw relative strength of DJP against VBINX is needed to draw one simple conclusion; This is a down-trend, there are no signs for a reversal in sight and therefore there are other asset classes that are probably more interesting to have a look at....
In the previous post on asset classes it looked as if the pace of the decline in relative strength was slowing down. The green JdK RS-Momentum line was touching the 100-barrier causing the JdK RS-Ratio line to start moving flat. However, this slight improvement did not last very long as only a few weeks later DJP started dropping like a stone again and it is now hugging the lower boundary of the already pretty steep falling trend-channel. This renewed weakness on the price chart caused a "jiggle" in the RS-Ratio line but it is now clearly heading lower again. The relative downtrend against VBINX continues in full force.
Just like for VBQ it is very tempting to start calling the end of this move on both the relative and the price charts. But again there are no signs of a slow-down of the down-trend or an improvement in sight, at least not through my technical glasses. This makes any long or overweight position in this ETF a blind bet and an attempt to catch a falling knife.
The rest of the universe
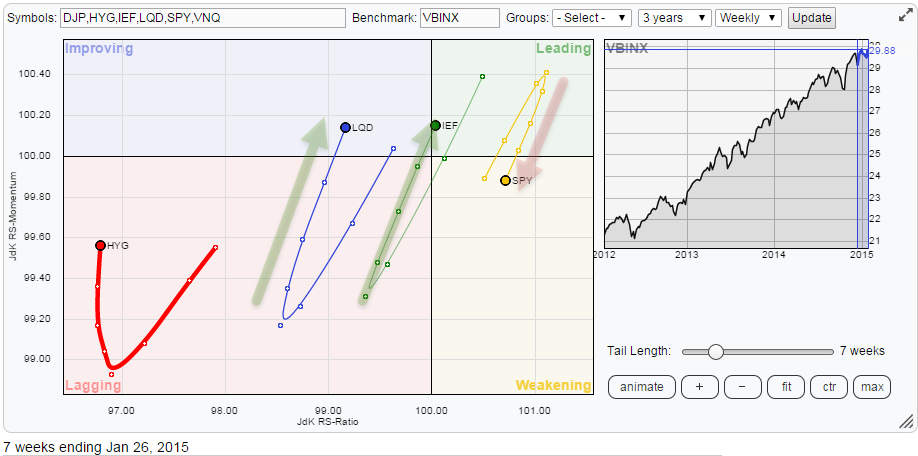
If we zoom in on the RRG there is a bit more rotation to see what could easily be overlooked by the dominance of the very strong and very weak rotation of Real Estate and Commodities. If we take those two out of the equation we get the picture above.
And while SPY (equities) is still higher, and therefore more positive, on the RS-Ratio axis it certainly looks as if IEF and LQD are closing in. Over the past few weeks SPY has rotated down into the weakening quadrant while IEF and LQD, and to a lesser extent HYG have rotated up. The pattern clearly shows weakening going on in equities and strength picking up for the fixed income (related) asset classes.
As all this rotation is taking place very close to the benchmark, please bear in mind that this RRG above is zoomed in, it is still early and therefore hard to make a definite call but for sure it is a warning sign that something may be cooking in the relation between stocks and bonds. It is definitely not as clear as it used to be for a long time.
Equity - Bond rotation
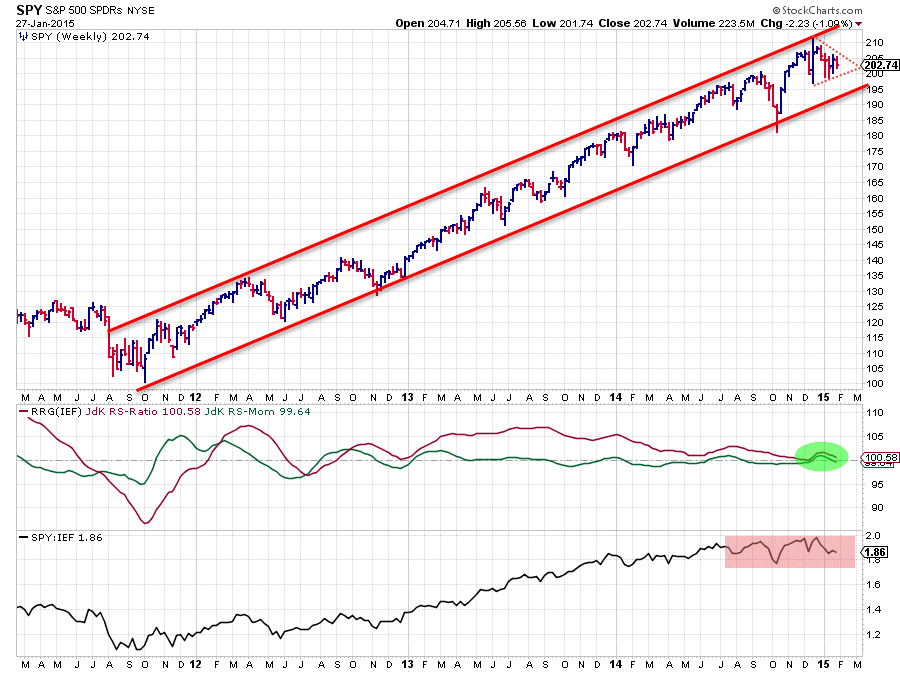
The up-trend in price in SPY is still undeniable and looking strong. The very regular series of higher highs and higher lows continues to be nicely confined within a rising channel and there is clearly enough leeway to the down-side before we need to start worrying that this trend is going to break.
However, the relationship with bonds is a different story. The JdK RS-Ratio line has been gradually moving lower and touched the 100-mark a few weeks ago but did not break lower. Instead the recovery in the equity markets pulled the RS-Ratio line up again preventing it to break lower against IEF (bonds). But how convincing is this move? Not really ....
Looking at the raw RS-line a sideways pattern is becoming more and more visible with the most recent highs not being able to break beyond the August-September 2013 highs.
This now means that Equities and Bonds are moving more or less at the same pace and there is no real preference for either one. Question remains: for how long? Unfortunately there is no clear answer to that, maybe the small triangle that can be detected at the end of the price chart of SPY at the moment will give us a clue in a few weeks.
Conclusion
- Real Estate / VNQ continues strongly
- Commodities / DJP remain at the opposite edge of the spectrum
- Equities / Bonds rotation stalling at 100-level, no preference for now.
Julius de Kempenaer | RRG research
RRG, Relative Rotation Graphs, JdK RS-Ratio and JdK RS-Momentum are registered TradeMarks by RRG research.


