RRG Charts October 31, 2017 at 10:58 AM
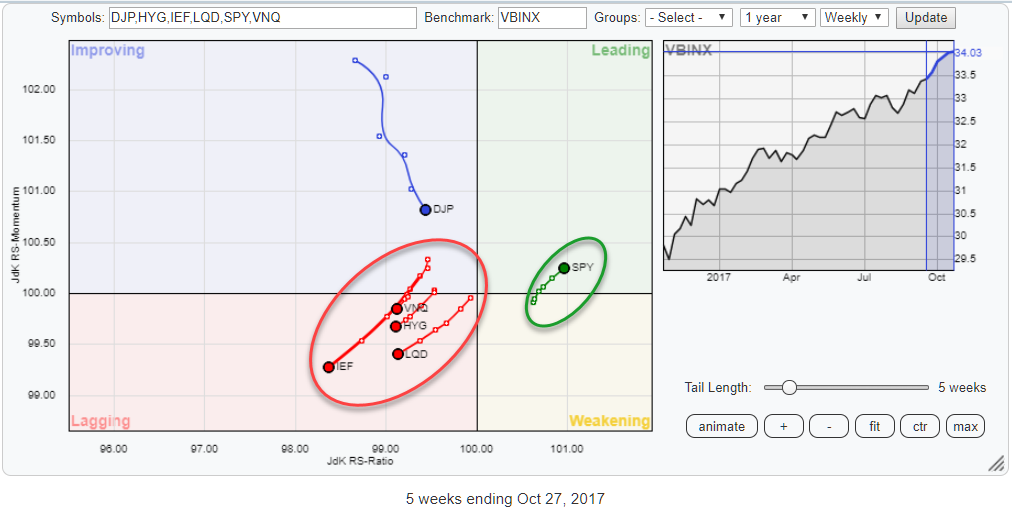
The Relative Rotation Graph above holds six ETF that represent various asset classes. The picture gives you the big picture of what is going on at asset class level on a relative basis against VBINX which is a Vanguard balanced index fund (60% equity / 40% bonds)... Read More
RRG Charts October 12, 2017 at 12:56 PM
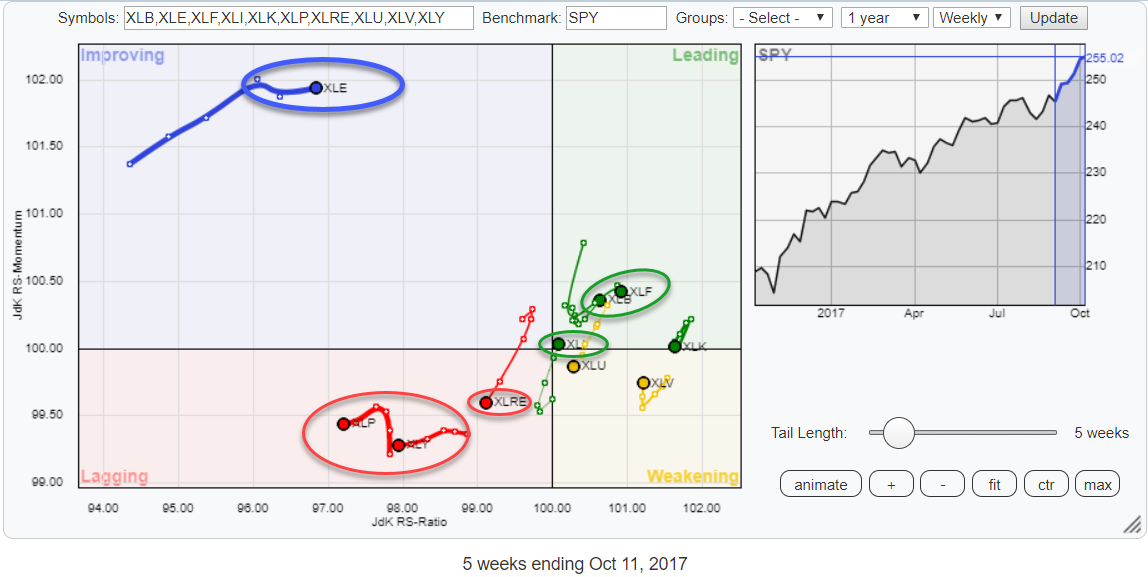
The Relative Rotation Graph for US sectors shows seven sectors clustered around the benchmark in the middle of the graph (SPY) and three of them further away... Read More
RRG Charts October 04, 2017 at 08:39 AM
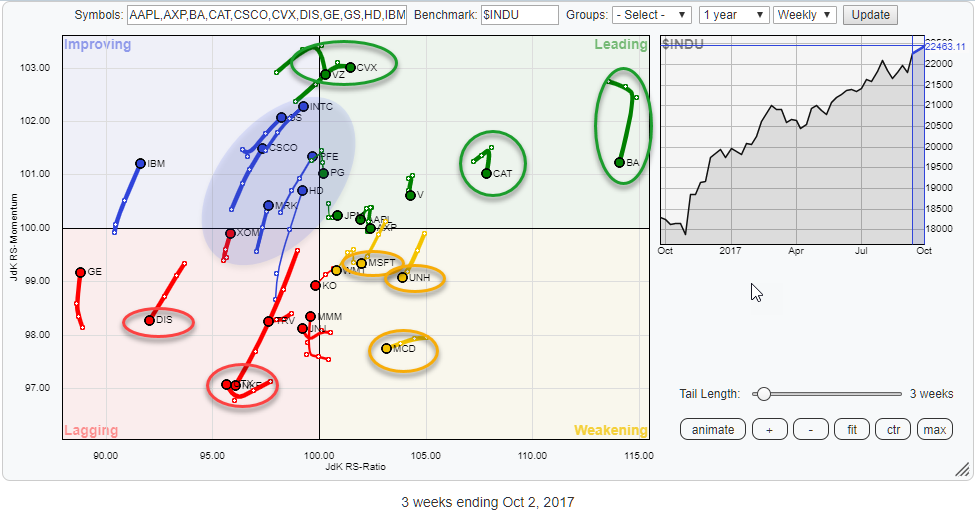
Plenty of actionable rotation towards the edges of the Relative Rotation Graph above. The RRG holds the 30 members of the Dow Jones Industrials index. Scanning around the outside of the chart the following stocks draw the attention... Read More