RRG Charts December 30, 2017 at 10:11 AM
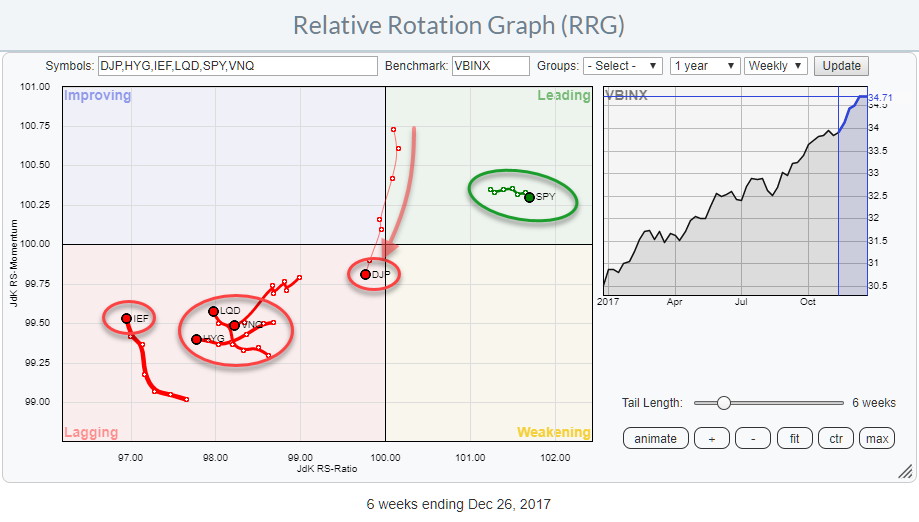
As 2017 draws to an end, the Relative Rotation Graph for asset classes is sending a very clear message! Equities are leading the way into 2018! The RRG above shows some ETFs representing various asset classes and uses VBINX, a balanced index fund, as the benchmark... Read More
RRG Charts December 18, 2017 at 11:47 AM
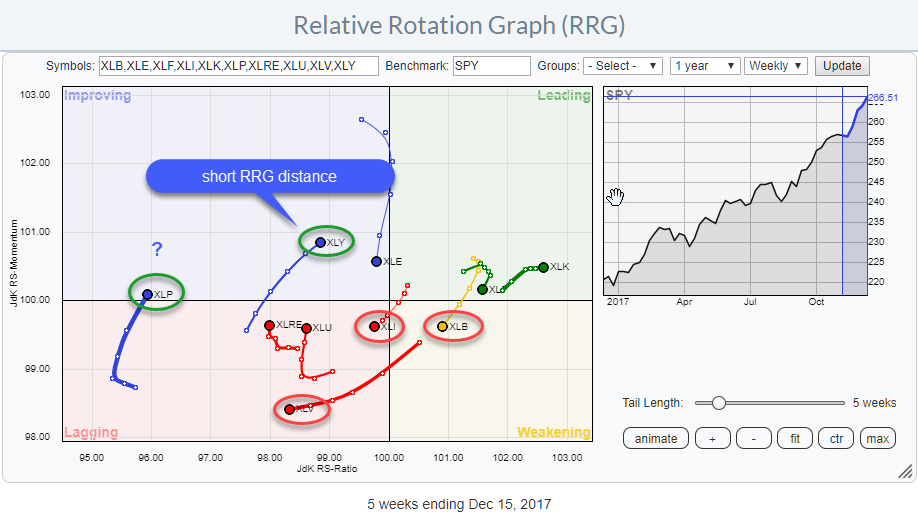
The Relative Rotation Graph for US sectors is showing us three sectors to avoid but also two which may offer good potential. Inside the leading quadrant, we find XLK and XLF still being the strongest sector in US equity market based on their JdK RS-Ratio reading... Read More
RRG Charts December 08, 2017 at 06:11 AM

Last week Wednesday (29 November) I was the guest of Tom and Erin in the Market Watchers Live show. During the show, we talked a lot about RRG, Relative Rotation Graphs, covering some basics and some new(er) techniques and interpretations that I have been working on... Read More