
RRG ChartsNovember 01, 2024 at 07:45 PM

In this video from StockCharts TV, Julius begins by looking back at the completed monthly bars for October to assess the long term trends in the 11 S&P sectors. He follows that up with an updated view for SPY in coming weeks...Read More
RRG ChartsNovember 01, 2024 at 12:51 PM

Following the recent market fluctuations, with a sharp decline and a subsequent rally, it's crucial to examine these movements' underlying factors...Read More
RRG ChartsOctober 25, 2024 at 03:49 PM
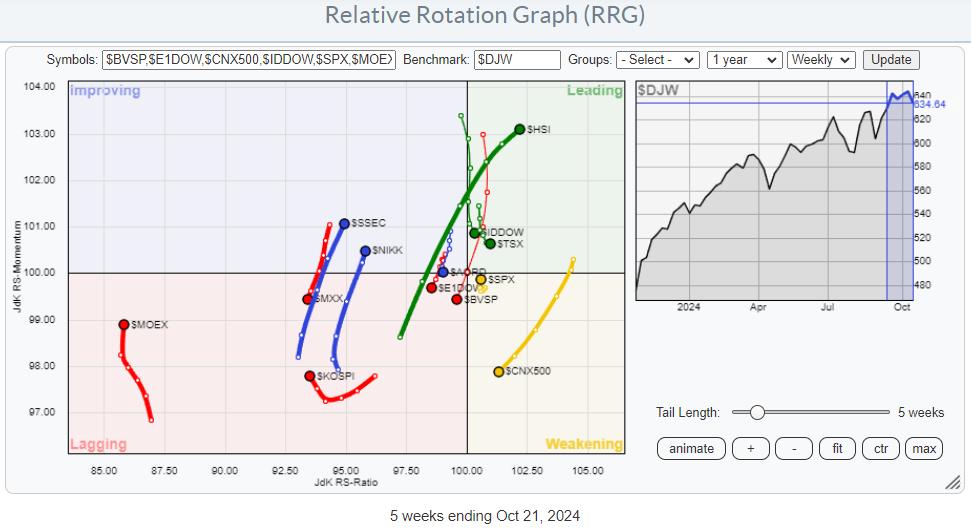
The global stock market is a big place, and it extends far beyond the borders of the United States. While the US market is undeniably the largest and often sets the pace for others, it's revealing to step back and consider the global scene occasionally...Read More
RRG ChartsOctober 22, 2024 at 06:10 PM
In this video from StockCharts TV, Julius begins by looking back at the completed monthly bars for October to assess the long term trends in the 11 S&P sectors. He follows that up with an updated view for SPY in coming weeks...Read More
RRG ChartsOctober 18, 2024 at 03:34 PM
In this week's RRG video, I shared my concerns about the current market conditions. The sector rotation model and current sector rotation, as we see it on the Relative Rotation Graph for US sectors, are sending us conflicting signals...Read More
RRG ChartsOctober 16, 2024 at 07:17 PM

In this video from StockCharts TV, Julius dives in to the sector rotation model, trying to find any alignment between theoretical and real-life rotations of sectors in combination with the economic cycle...Read More
RRG ChartsOctober 10, 2024 at 05:16 PM
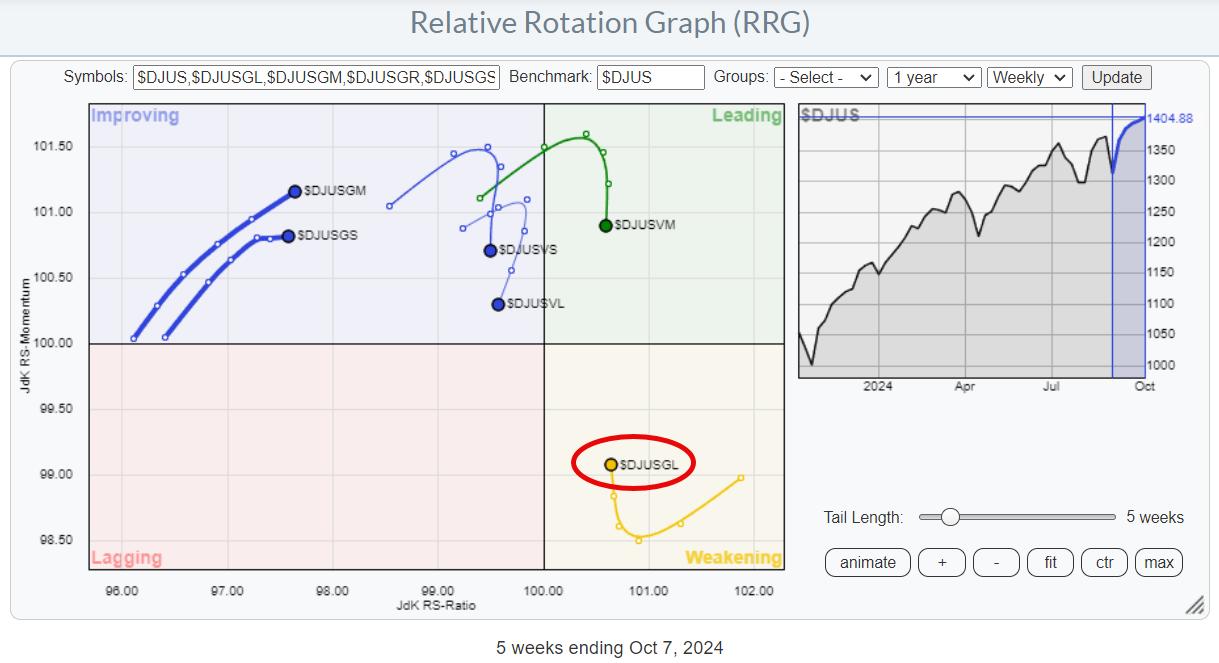
Where is the Recent Performance in the S&P 500 Coming From? Let's start with the relative rotation graph (RRG) for growth and value sectors, dissected by size to get a clearer picture. The first RRG reveals a standout performer: the large-cap growth group...Read More
RRG ChartsOctober 08, 2024 at 02:11 PM

In this video from StockCharts TV, Julius presents a few conflicting rotations and signals that continue to warrant caution while the S&P 500 keeps hovering just above support. With the negative divergences between price and MACD/RSI remaining intact, SPY should not break 565...Read More
RRG ChartsOctober 03, 2024 at 05:57 PM

In this video from StockCharts TV, Julius explores the October seasonal outlook for the S&P 500 and various sectors...Read More
RRG ChartsOctober 01, 2024 at 02:19 PM

In this video from StockCharts TV, Julius takes a detailed look at the monthly charts for all US sectors and the S&P 500. With many sectors breaking to new highs, he highlights how the long-term uptrend for the S&P 500 remains intact...Read More