
RRG ChartsMay 20, 2024 at 03:43 PM

In this video from StockCharts TV, Julius assesses the quality of the breakout in the S&P 500, using sector rotation on Relative Rotation Graphs, the volume pattern in the S&P 500 and the relationship between stocks and bonds. This video was originally broadcast on May 20, 2024...Read More
RRG ChartsMay 17, 2024 at 12:49 PM

No Confirmation In Volume This week, the S&P 500 is breaking out above its previous high, undeniably a bullish sign. After the initial break on Wednesday, the market held up well on Thursday. However, a few things are holding me back from getting overly enthusiastic...Read More
RRG ChartsMay 09, 2024 at 07:03 PM
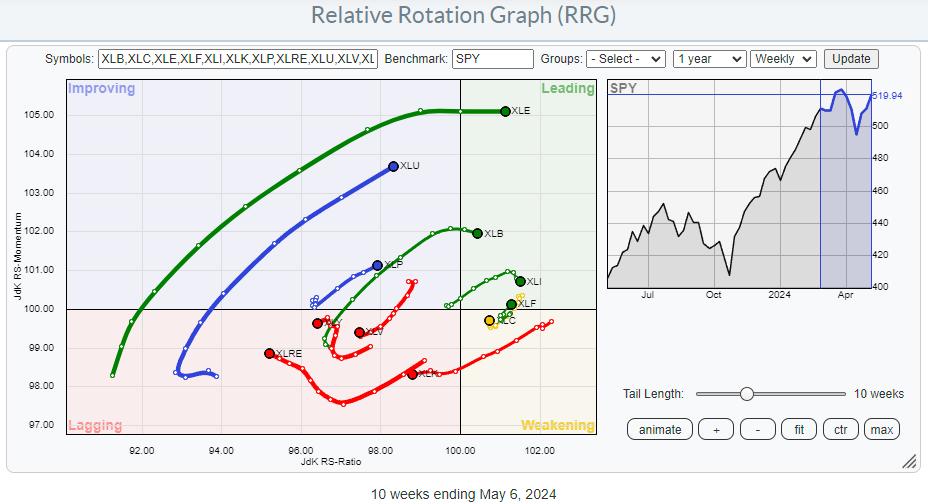
The Relative Rotation Graph for US sectors shows long tails for XLE and XLU. Both are on a strong RRG-Heading toward or into the leading quadrant. Also inside the leading quadrant are XLB and XLI, though they have rolled over and are starting to lose a bit of relative momentum...Read More
RRG ChartsMay 03, 2024 at 07:10 AM
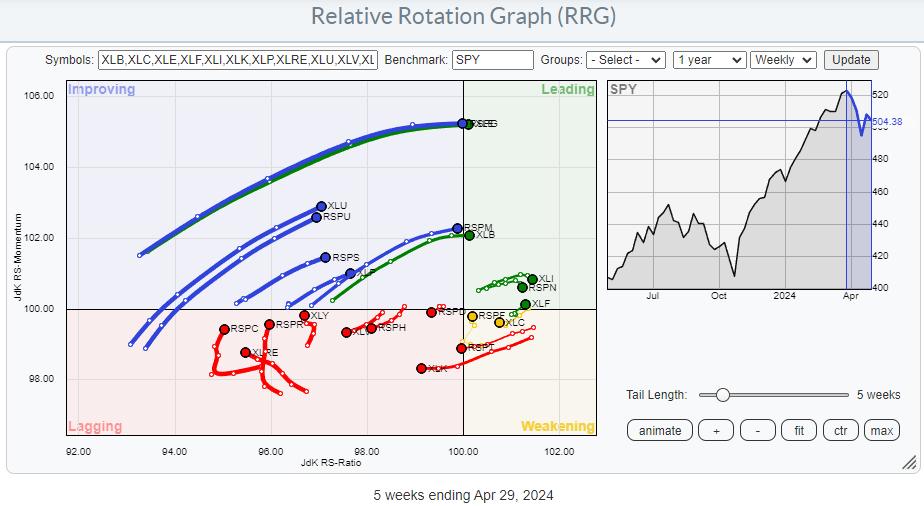
All on the Same Track... or? The difference between equal-weighted sectors and cap-weighted sectors is obvious. Namely, the cap-weighted variant is much heavier and is impacted by the changes in some heavy-weight, often mega-cap, stocks...Read More
RRG ChartsApril 24, 2024 at 07:20 PM
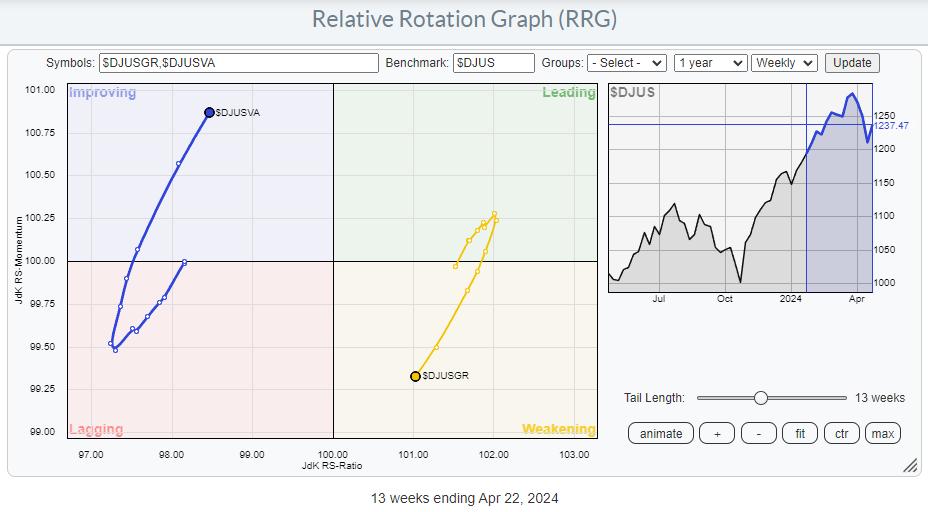
Value Taking the Lead from Growth The weekly RRG above shows the rotation for Growth vs. Value stocks, with the DJ US index as the benchmark. The recent rotation clearly shows the rotation out of growth into value taking shape and picking up steam...Read More
RRG ChartsApril 11, 2024 at 06:32 PM

A Sector Rotation Summary A quick assessment of current sector rotation on the weekly Relative Rotation Graph: XLB: Still on a strong trajectory inside the improving quadrant and heading for leading...Read More
RRG ChartsApril 05, 2024 at 03:21 PM
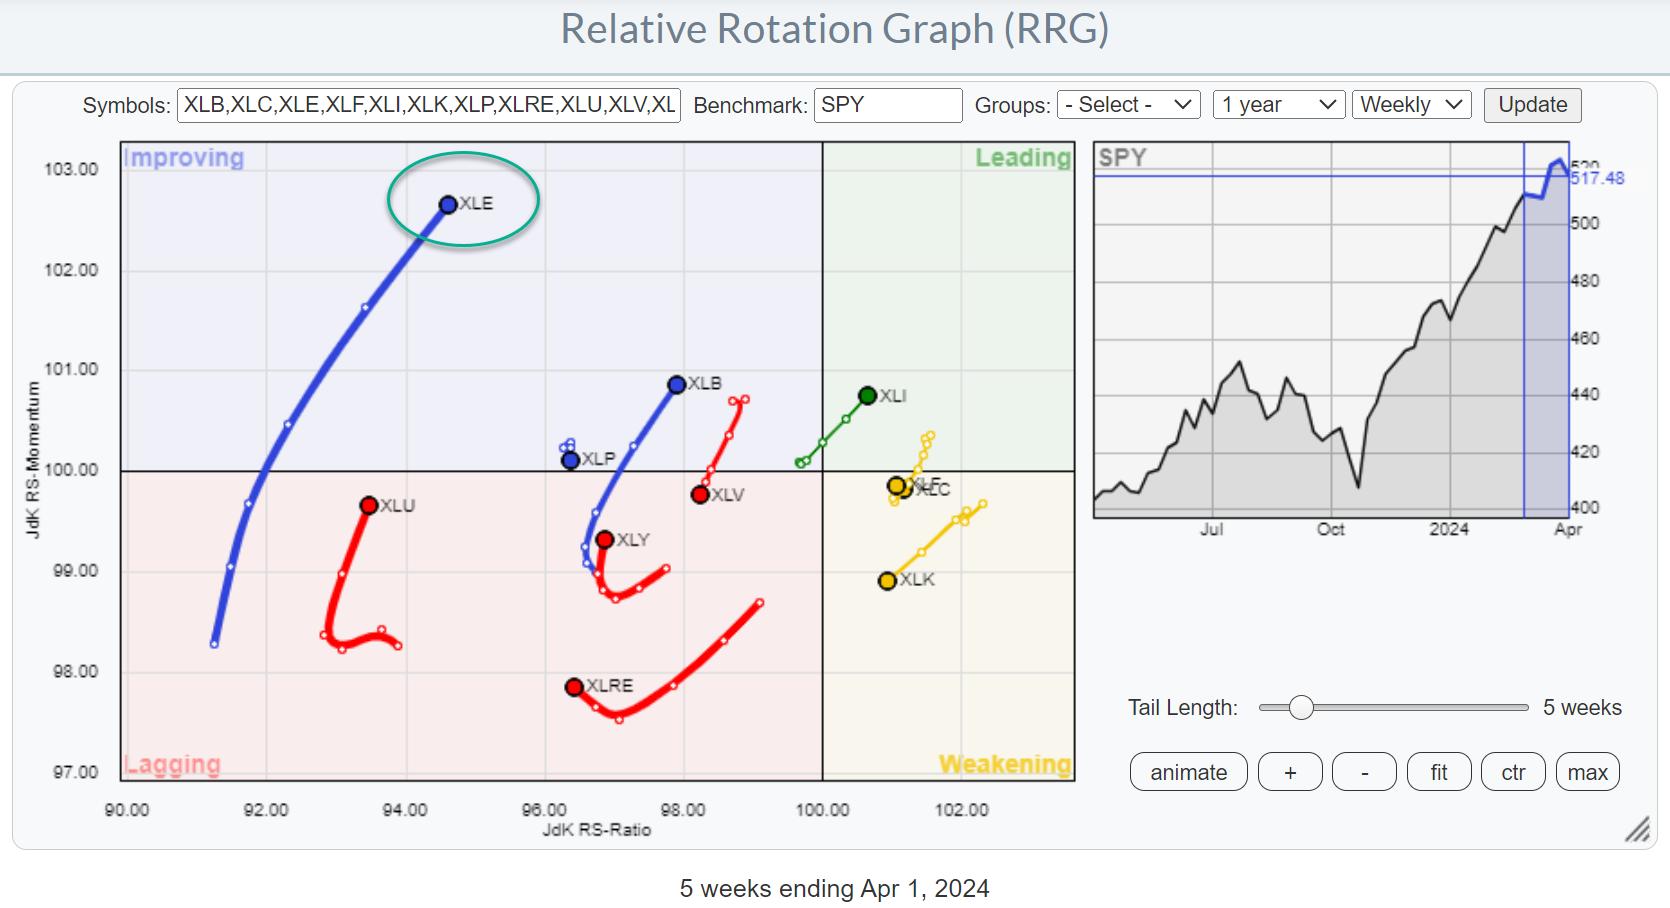
Strong Rotation on the Weekly RRG For a few weeks now, the improvement in the energy sector (XLE) is becoming increasingly visible in the lengthening of the XLE tail on the Relative Rotation Graph...Read More
RRG ChartsMarch 27, 2024 at 06:48 PM
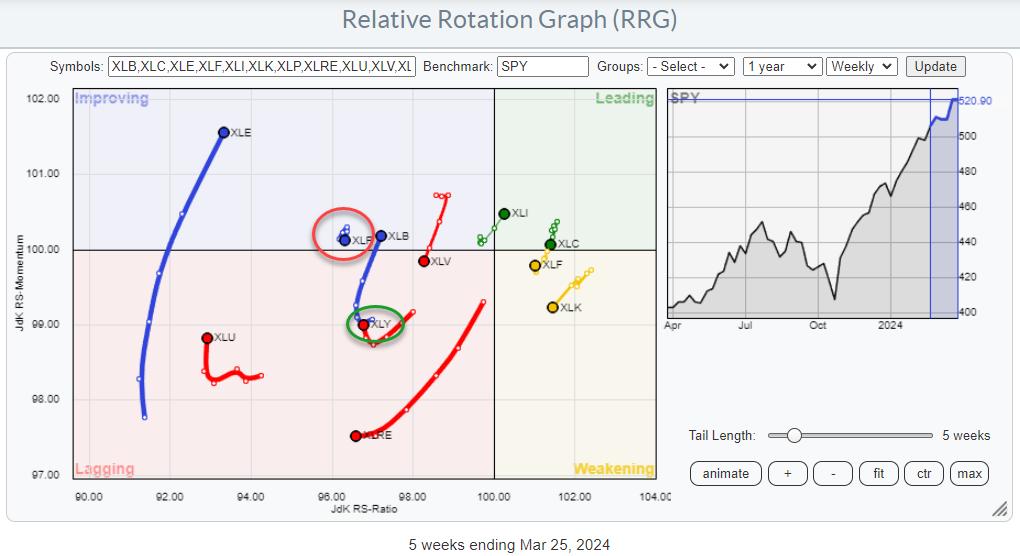
Summary The Relative Rotation Graph for US Sectors for this week mainly shows a continuation of the rotations as they were underway last week...Read More
RRG ChartsMarch 19, 2024 at 06:14 PM
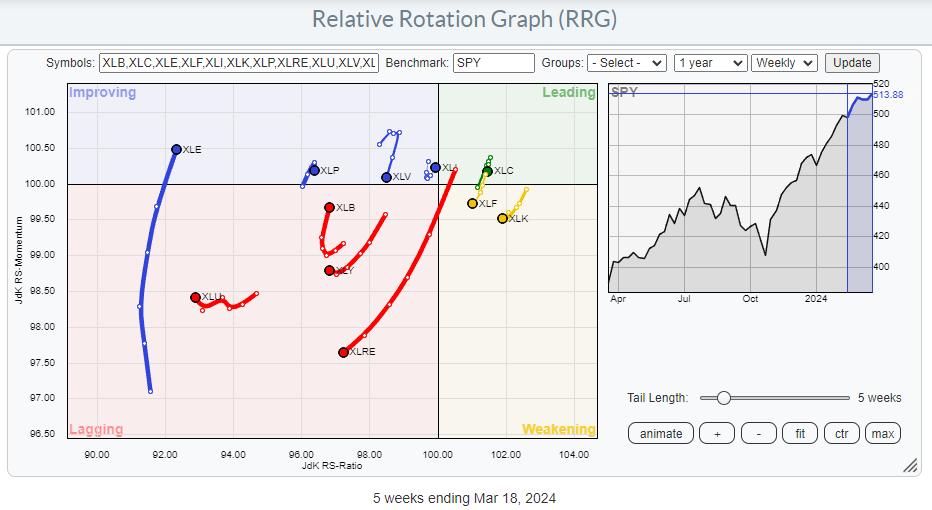
Energy Improving in Three Time Frames Watching the sector rotation at the start of this week shows a continued improvement for the Energy sector (XLE)...Read More
RRG ChartsMarch 08, 2024 at 03:26 PM

It is no secret that the NYFANG+ Index is still in in incredible up-run after bottoming out in October last year and subsequently breaking significant overhead resistance around 8.000. In the last 3-5 weeks, the index stalled just below 10.000 and moved sideways...Read More