The MACD is an awesome indicator, one that I use in my trading decisions every day. But there are misinterpretations at times, in my opinion, and I want to share a few of those with you. In my most recent article, "The Power of the MACD", I shared how a negative divergence can sometimes be a sign of slowing momentum, but not always. We have to let breakouts run their course before comparing MACD readings. Otherwise, you can make a big mistake and short a breakout on heavy volume simply because of a negative divergence that eventually gets eliminated. In that article, I also pointed out how MACD centerline crossovers can often provide misleading indications of a stock's trend reversal.
I want to add a couple more "secrets" about trading using the MACD. If you use anything other than a line chart, you'll sometimes see what appears to be a positive or negative divergence when, in fact, it really isn't. Or you won't see one that's staring you in the face. The following chart of AMN Healthcare Services (AHS) is a perfect example. Check it out:
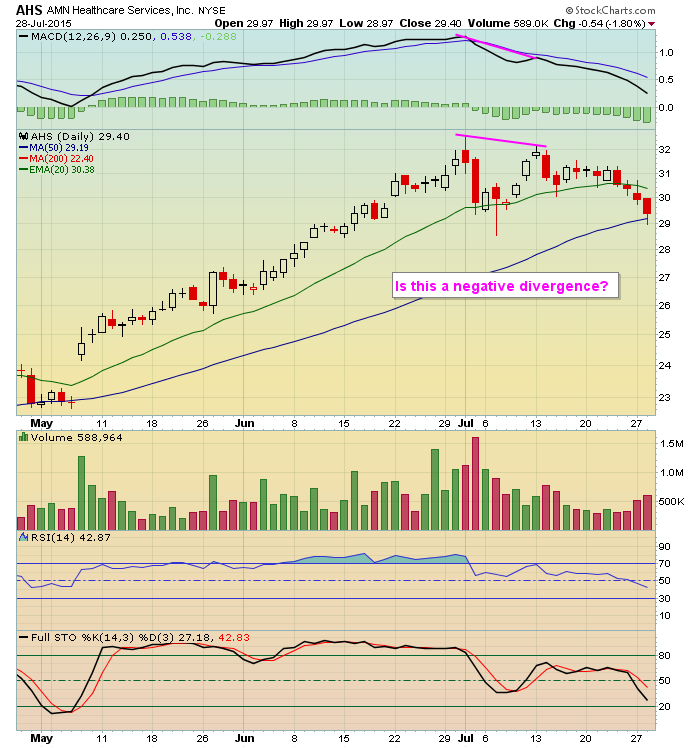
By definition, a negative divergence occurs when we see price highs accompanied by lower MACD readings. At first glance, the MACD is certainly lower but it doesn't appear that AHS has reached a new price high. So is this a negative divergence? The answer is yes. The first thing you must keep in mind is that the MACD is based on CLOSING prices, not intraday prices. One of the very few times I'll use a line chart is to clarify whether a positive or negative divergence exists on a chart. The line chart ONLY considers closing prices and the negative divergence in this case is much easier to see. Take a look:
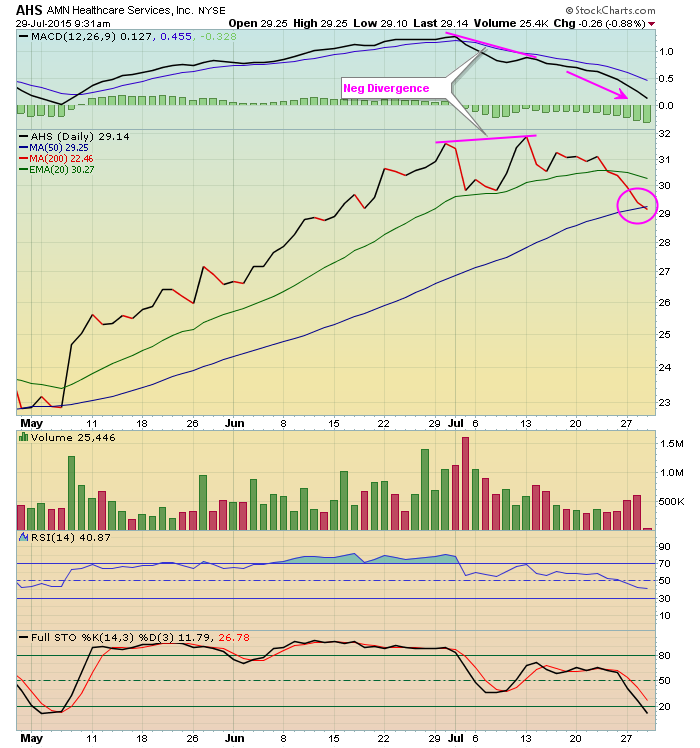
If you have a trained eye using candlesticks, you can see past the optical illusions, but if you're ever in doubt, use a line chart for clarity.
In addition to the negative divergence that was present on the AHS chart, volume also was slowing on the last high. Now AHS appears to be printing the 50 day SMA and/or MACD centerline tests that I look for after a negative divergence surfaces.
Here's a second MACD secret that I tend to follow. When the MACD becomes 10% of the stock price, it's due to a violent price swing in one direction or the other and the MACD becomes very stretched. The problem is that momentum to that degree is very difficult to sustain so an ensuing positive or negative divergence will likely print based on mathematical certainty and it's not truly reflective of slowing momentum where we're more likely to see a reversal. XOMA Ltd (XOMA) is a perfect example:
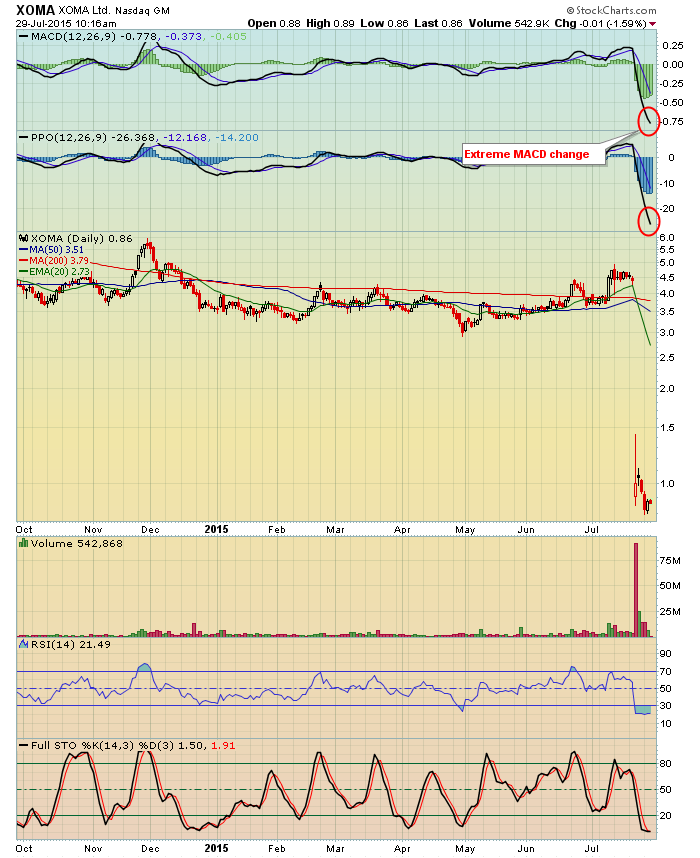
XOMA reported bad news recently regarding a drug trial and the stock was slammed with the stock losing 80% of its value at the open the next day. That caused a huge drop in the MACD and that indicator now stands at -.78. The stock trades for less than a dollar so what's the chance the MACD (difference between 12 day EMA and 26 day EMA) will move any lower? Slim to none. So when the MACD begins to rise, which will happen with near certainty, does it mean the selling has abated and you want to own it? That's not the case for me. Technically, the pace of decline in the MACD will slow, but is that the type of slowing momentum you're looking for in a stock? Check out Angie's List (ANGI) in 2014. It's MACD neared the 10% threshold and the stock continued moving lower for weeks. Here's the chart:
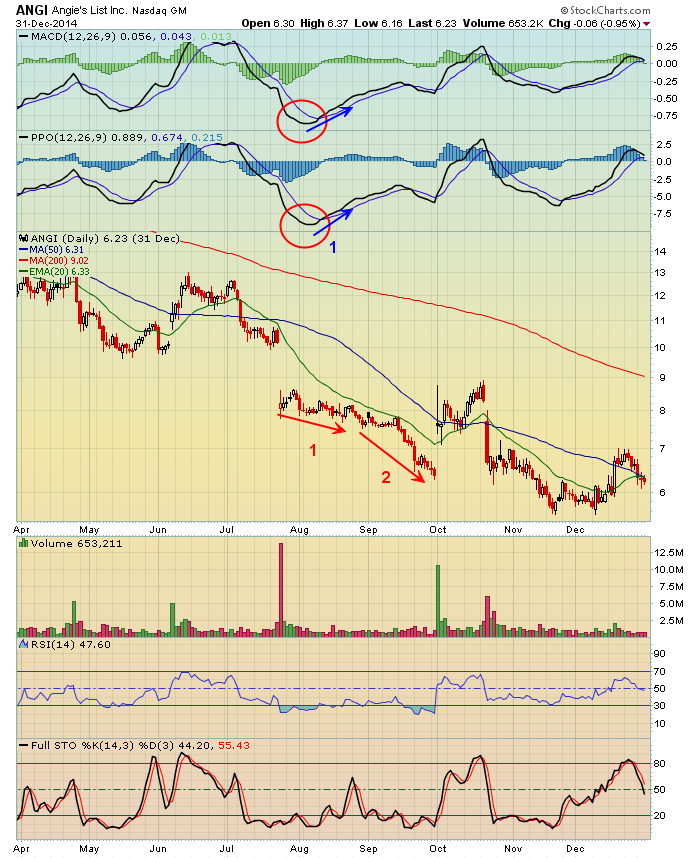
In this case you can see from the red arrow, point 1 that a positive divergence has emerged and while that may be telling us that momentum to the downside is slowing, that didn't keep ANGI's stock price from dropping much further the next several weeks (red arrow, point 2). Again, we have to understand the limitations of technical indicators. There is no substitute for common sense.
In today's webinar, I'm going to talk about how I use the MACD in my short-term trading strategy to minimize risk - and I'll also be including a blog article soon to discuss the same. If you'd like to attend today's webinar, it's FREE and begins at noon EST. You can CLICK HERE for registration.
Happy trading!
Tom


