For me, the Moving Average Convergence Divergence (MACD) trails only the combination of price and volume in my hierarchy of trading tools and indicators. It's THAT good. But it has one major limitation in that it only considers price action, not volume. Hence, it cannot be trusted as much as price/volume. There are many reasons why the MACD works in gauging momentum, too many in fact to discuss in one blog article so I'll write about the MACD often. But I would suggest that before you follow ANY indicator that you fully understand how and why that indicator works - and its limitations. Buying or selling a stock simply because "this line crosses that line" is a recipe for disaster. You're swimming in a sea of market maker-infested waters and your capital is the bait. When I lose on a trade, I want to at least know that I had a plan to limit my risk and maximize my potential return. If it results in a loss, then so be it. Stock trading is a zero-sum game. Someone is going to win and someone is going to lose. Our goal should be two-fold: (1) to win more than we lose and (2) to have higher percentage winners than losers. If we can achieve both, we'll make money. It sounds easy, but it takes a lot of knowledge, patience, discipline and experience.
The MACD is a powerful tool to help us achieve our goals.
The first step in using the MACD is understanding the MACD. Just look at the name - Moving Average Convergence Divergence. The MACD is nothing more than a line that tracks the difference between any two exponential moving averages (EMAs). The standard is the difference between the 12 period EMA and the 26 period EMA. Let me provide a simple illustration of exactly what the MACD is and I'll use Google's (GOOGL) chart. Check this out:
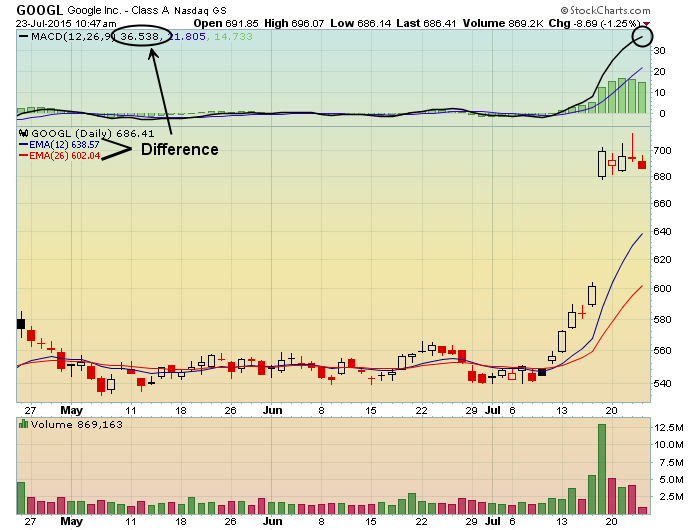
You can click on the chart to check the settings, but I simply changed my overlays to the 12 day EMA and 26 day EMA. From there you can calculate the difference between the two and compare it to the number and the line highlighted with the black circles. Now you know what the number and the black MACD line represent. The blue number (and the blue MACD line) represents the 9 day moving average of the MACD. So it's a "smoothing" of momentum, if you will.
If the MACD is above its centerline or zero line, it tells us that the shorter-term moving average is higher than the longer-term moving average. If the line is rising, it simply implies that short-term momentum is strengthening as the short-term moving average is rising faster than its longer-term counterpart. Likewise, if the MACD is below its centerline or zero line, it tells us that the shorter-term moving average is lower than the longer-term moving average - bearish momentum based on price action. On the above GOOGL chart, note that GOOGL's MACD hovered near the centerline for months. Then check out the price action during that same period, which went absolutely nowhere. The MACD is our visual aid that there really was no momentum whatsoever in GOOGL for months and we really didn't want to commit capital to it as a momentum trader. However, momentum began to strengthen and price broke out just before earnings. GOOGL's earnings report was strong and you can now see that momentum here has strengthened significantly by the massive jump in the MACD. Personally, I'll be looking for entry into GOOGL during a period of weakness, perhaps when it tests its rising 20 day EMA. The top of gap support - near 680 - should provide nice support initially but if that fails, be very careful.
By definition, it would seem that any cross of the MACD centerline would be a buy or sell signal, right? After all, it's telling us that the short-term moving average has either crossed above or below the long-term moving average. You need to be careful making this assumption and it's easier to provide you an example rather than trying to explain it. Take a look at a 15 month daily chart of Apple (AAPL):
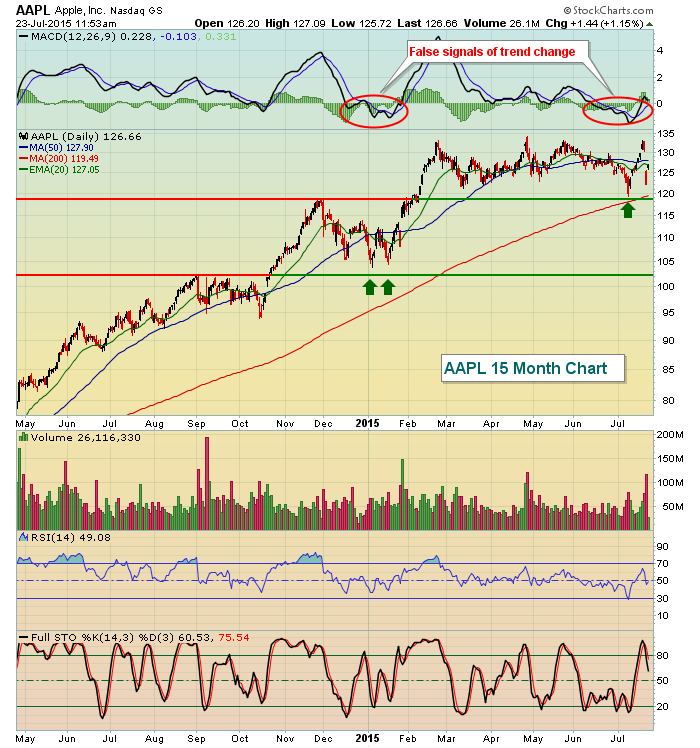
Technical analysis 101 suggests that broken price resistance turns to price support. Over the past year, AAPL has twice pulled back to hold major price support while its MACD turned bearish. If you follow the MACD as your primary indicator in trading, you'd have been in big trouble trying to short this apparent change in momentum. Price support was never lost and the uptrend continued. That's why the MACD takes a back seat to the combination of price/volume in my trading arsenal.
The following is another improper interpretation in the MACD that I want to discuss. Many times, just as a stock is breaking out, you'll see the MACD at a lower level than it was at the prior high, resulting in a textbook negative divergence. The problem, however, is that the breakout has just taken place and if it's on heavy volume we want to let the new breakout and uptrend run its course before comparing MACD readings. Again, let me provide an example. Here's a chart of Acuity Brands (AYI) that shows three negative divergences, the first two of which provided us excellent clues of slowing momentum. Check it out:
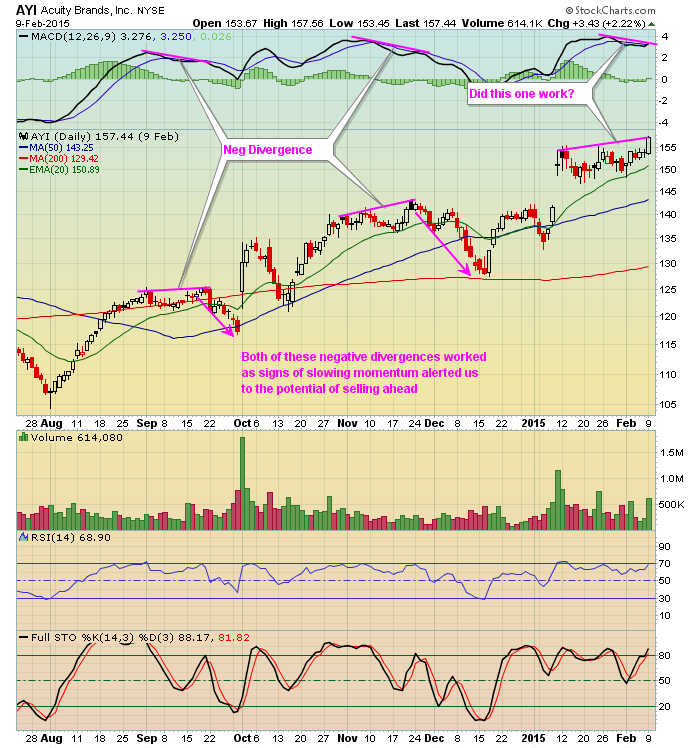
That last one failed to work. Check out the rest of the AYI chart:
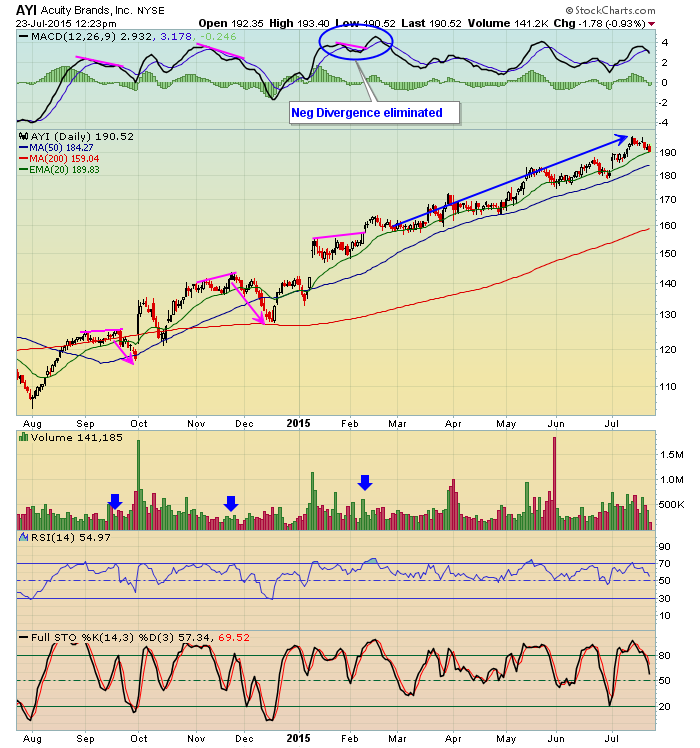
Remember the MACD only takes into account price action, not volume. If you look at the breakouts that created the negative divergences, the third one was accompanied by heavy volume (compare the volume levels for each of the three blue arrows). This is much more indicative of accumulation and bullish momentum based on volume. Again, the MACD ignores volume which is a big mistake on this chart. In addition, you'd have to look at a larger chart, but the first two breakouts either occurred or were followed by a reversing candle and loss of price support created by the breakout. Neither of those two bearish developments were present on that third breakout.
While the MACD is a wonderful indicator - most definitely one of my favorites - it has its limitations and misinterpretations which is why I always rely more heavily on what the price/volume combo is telling me. There are many other "secrets" and uses of the MACD that I'll explain in future blog articles so make sure you subscribe to my blog and receive my articles at the time they're published. To the upper right of this article under "Subscribe to this blog", click on "Email updates". Type in your email address and click "Subscribe".
Happy trading!
Tom


