Market Recap for Wednesday, October 21, 2015
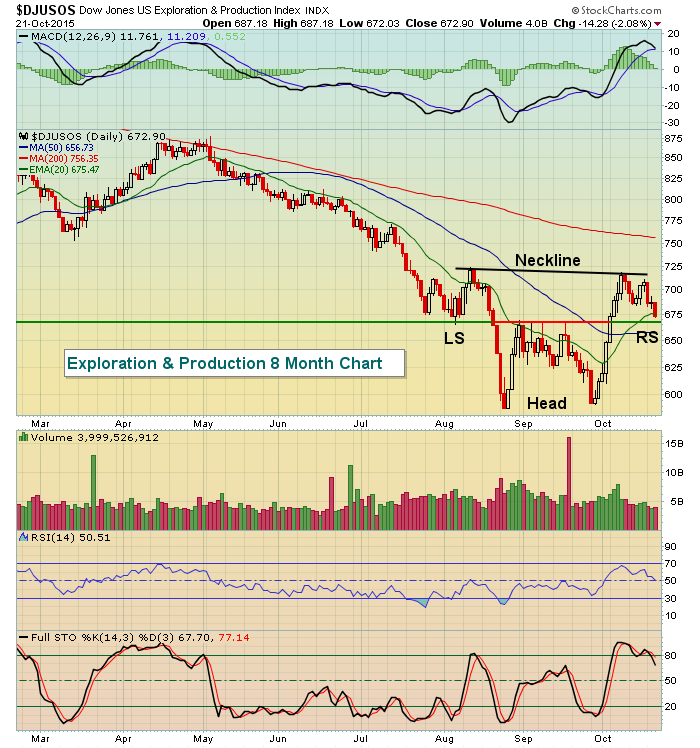
The U.S. stock market closed on a sour note on Wednesday as only very minor gains in consumer staples and industrials saved the bulls from an entire sector sweep. Leading to the downside were energy and healthcare as it's been either feast or famine for both those groups of late. Coal ($DJUSCL), which typically enjoys seasonal strength in October, led energy shares lower as this beaten down industry group dropped another 6.6% Wednesday, adding to very poor action over the last week or so. Last Thursday, the DJUSCL closed at 28.59. It finished on Wednesday at 23.84. Renewable energy ($DWCREE) fell nearly 3.3% on Wednesday, contributing to the relative weakness of energy. Worse yet, the DWCREE failed to hold both its 20 day EMA and 50 day SMA on the selling, which could lead to a resumption of its prior downtrend - not good news for the sector. The Dow Jones U.S. Exploration & Production index ($DJUSOS) should be watched closely as it closed near what has been a very pivotal level in the past. Check this out:
Healthcare providers ($DJUSHP) and pharmaceuticals ($DJUSPR) were both very weak and that led to relative weakness in healthcare shares. Valient Pharmaceuticals (VRX) was rumored by a short seller to have provided fraudulent financial information and while the stock finished well off its lows, it was still down 19% on the session on massive volume.
Pre-Market Action
Asian markets were mostly lower overnight while trading in Europe has been mixed throughout the session thus far. U.S. markets finished weak on Wednesday, but futures are higher this morning to reflect several better-than-expected earnings results and another tame initial jobless report this morning.
Texas Instruments (TXN) posted very solid results after the bell Wednesday and this semiconductor company is higher by 8% this morning. It will be interesting to see if TXN can build on its pre-market gains throughout today's session.
American Express (AXP) is receiving the opposite treatment, down 3% after disappointing Wall Street with its numbers and guidance.
Current Outlook
The price action over the past couple months - since the August low - has been bullish as that low has continued to hold as support. The problem I have with the rally is that money seems to be rotating towards more defensive areas of the market and that needs to change. For instance, 10 year treasury yields ($TNX) fall when treasuries are bought. There's an inverse relationship there. Typically, we see the TNX rise to support a rising equity market as the proceeds from the sale of treasuries help to fuel the rise in equities. Yet when we look at a chart, we see the TNX on the verge of a significant breakdown. Hence, the rotation towards treasuries. Check out the TNX:
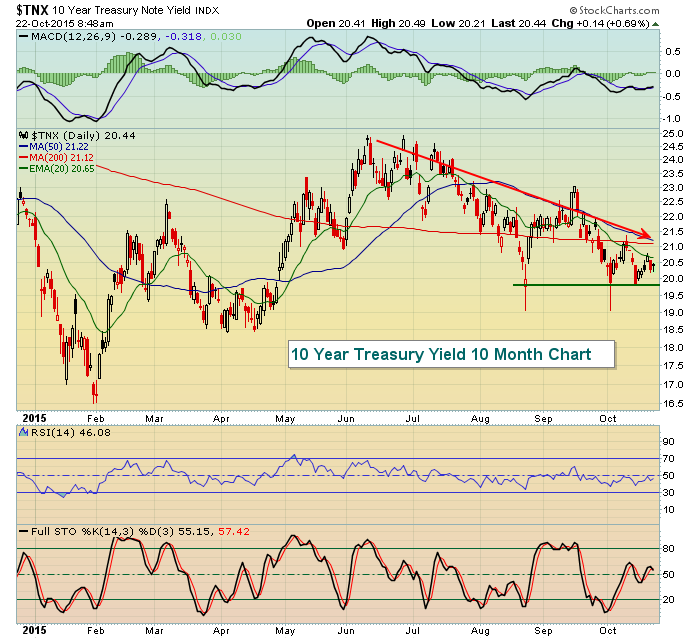
Loss of yield support near the 1.98%-2.00% level could add much more selling pressure to equities so watch the TNX.
In addition, money has been flowing away from small cap, U.S.-based stocks (Russell 2000) and into the more defensive S&P 500. Money flowing away from small caps and into treasuries signals that the U.S. economy may not be nearly as strong looking ahead as the Federal Reserve has led us to believe and could be why they haven't yet raised interest rates. Just a thought. Anyhow, take a look at the ratio of the Russell 2000 vs. the S&P 500. This continuing downtrend since summer is bothersome:
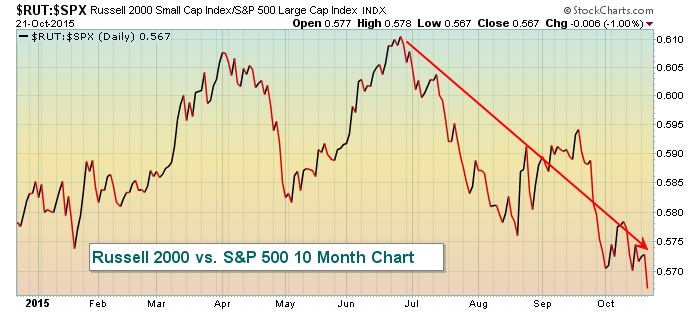
Not only has this ratio been falling, but it also closed at a fresh 2015 low on Wednesday. Normally, a bull market is sustained by money flowing into aggressive areas like the Russell 2000. The above chart reflects just the opposite mentality right now. Again, it's a concern.
Sector/Industry Watch
Semiconductors ($DJUSSC) will be in focus today. They printed a reversing candle on Wednesday after testing key price resistance. Over the past month, the DJUSSC is the best performing industry group within technology, rising 7.3%, more than double any other technology industry group with telecommunications equipment ($DJUSCT) being the exception (+6.35%). Take a look at the chart:
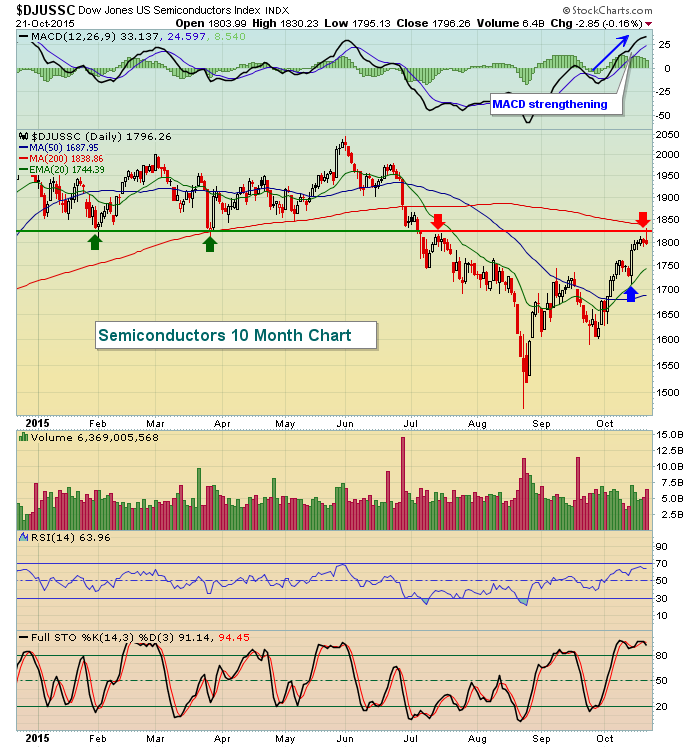
There are bullish and bearish arguments to be made regarding the above chart. The blue arrow shows the rising 20 day EMA holding as key support, which normally occurs in bullish market environments. But thus far, price resistance is holding close to 1830. Which side breaks first? A breakout above 1830 would be bullish, while losing 20 day EMA support on a closing basis would be short-term bearish.
Historical Tendencies
There are significant discrepancies in annualized returns on the S&P 500 by the day of the week. For instance, Mondays have produced annualized returns of -15% on the S&P 500 since 1950. Wednesdays and Fridays have produced annualized returns that double the 9.0% average annual return of the S&P 500.
Mondays that fall during the bearish 19th to 27th days of calendar months are generally the worst days for the bulls.
Key Earnings Reports
(actual vs. estimate):
CAT: .75 vs .75
DOW: .82 vs .68
FCX: (.15) vs (.08)
KLAC: .71 vs .56
LLY: .89 vs .76
LUV: .94 vs .92
MCD: 1.40 vs 1.27
MMM: 2.05 vs 2.01
PCP: 2.49 vs 2.94
RTN: 1.47 vs 1.40
SIRI: .03 vs .03
UA: .45 vs .44
UAL: 4.53 vs 4.49
(reporting after the closing bell today):
AMZN: (.10) (est)
COF: 1.92 (est)
GOOGL: 5.87 (est)
JNPR: .43 (est)
MSFT: .58 (est)
T: .68 (est)
Key Economic Reports
Initial jobless claims released at 8:30am EST: 259,000 (actual) vs. 265,000 (estimate)
August FHFA house price index to be released at 9:00am EST: +0.5% (estimate)
September existing home sales to be released at 10:00am EST: 5,350,000 (estimate)
September leading indicators to be released at 10:00am EST: +0.0% (estimate)
Happy trading!
Tom


