Market Recap for Thursday, October 29, 2015
All of our major indices saw selling on Thursday, although losses on the Dow Jones and S&P 500 were relatively minor, with the latter losing less than one point. Action was contained in a fairly tight range with energy (XLE) and healthcare (XLV) providing relative strength while utilities (XLU) and technology (XLK) were the primary drag. Considering the huge gains in October, the bulls were likely pleased to hold onto most of their gains. The Russell 2000 ($RUT) was clearly the disappointment on the session as this small cap index fell more than 1.1% just a day after leading the market in a big way. The RUT will see its first short-term test at the opening bell today as Thursday's weakness saw its price testing rising 20 hour EMA support. After breaking out of its recent 1130-1170, it appeared to begin an uptrend. If that's the case, the 20 hour EMA should hold as support. Here's the current look:
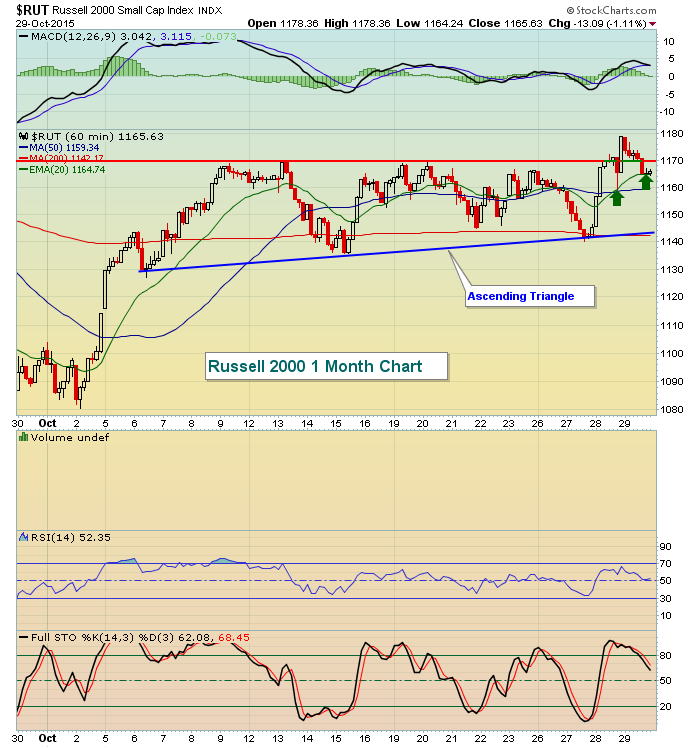
If you look back to the October 15th break above the 20 hour EMA, you'll see a continuing rise with multiple bounces off 20 hour EMA support - until price resistance at 1170 was tested. Then the rally faded and the 20 hour EMA support was lost. The current rally actually broke that 1170 price resistance. Therefore, I believe this rally is more sustainable and the 20 hour EMA test is important for that reason. We'll likely know in the early going whether it holds. It would be bullish to see it hold and then have the Russell 2000 break above 1180.
Gambling ($DJUSCA) and trucking ($DJUSTK) shares were among the leaders on Thursday and both industry groups are at critical levels as they rally. I'm featuring the DJUSCA in the Sector/Industry Watch section below. Here's a look at the DJUSTK:
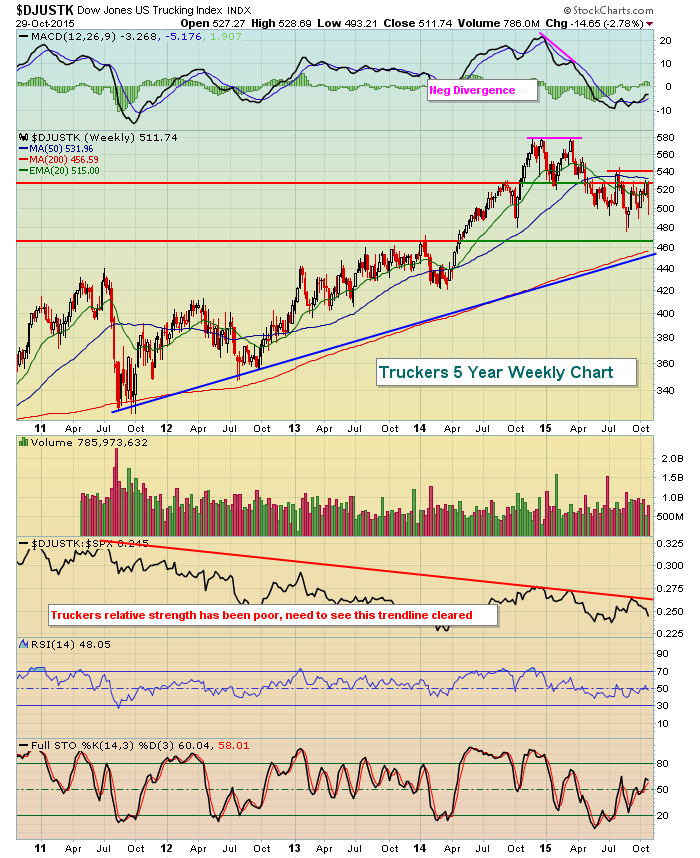
2015 hasn't been great to truckers, but slowing momentum on the weekly chart in the form of a negative divergence was the culprit. In addition, truckers have been a poor relative performer vs. the S&P 500 for years. The group could use two breakouts - one in terms of price above the recent price resistance range from 525-540 and the other the relative downtrend line vs. the S&P 500. That would drive much more rotation from other areas of the market. For now, it's stuck but improving.
Pre-Market Action
U.S. futures are upbeat this morning despite action overseas (Europe) where their major indices trade close to the flat line. Earnings this morning weren't great, but LinkedIn (LNKD) provided the bulls more ammunition on valuations after a much better than expected report last night. We should start higher, continuing the recent uptrend. Watch rising 20 hour EMAs for support in the near-term and keep in mind that money flows and history are likely to support the bulls.
Current Outlook
When it comes to evaluating the strength of the U.S. economy, feel free to listen to CNBC (yikes) or even the Federal Reserve, but I'll take my charts, thank you very much. The charts reflect the sum of all price action of market participants - who speak with their wallets, not their lips. The price action tells us where our economy stands. I look to the following three charts to help me determine what traders think of our economy. They are (1) the 10 year treasury yield ($TNX), (2) the ratio of transports ($TRAN) to utilities ($UTIL), and (3) the Russell 2000 ($RUT). Here's where these three currently stand:
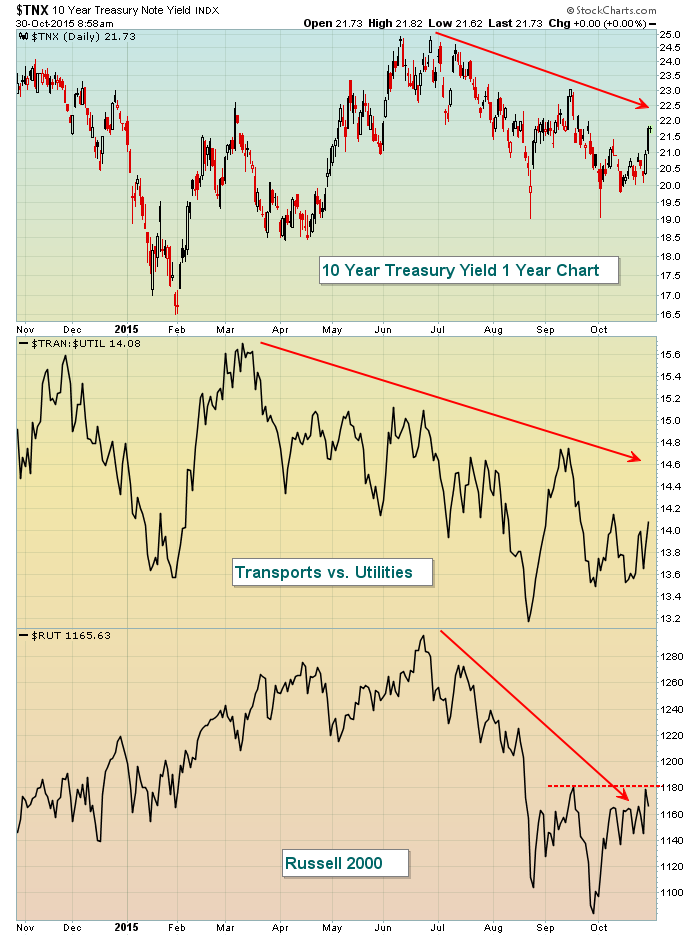
These have been downtrending during much of 2015, but they all are showing signs of strength off recent bottoms. Where these three go from here will help me determine whether our economy is improving or not.
Sector/Industry Watch
Gambling ($DJUSCA) stocks have been rolling the dice of late. They're now up against key price resistance and hoping their number is drawn. Check out the chart:
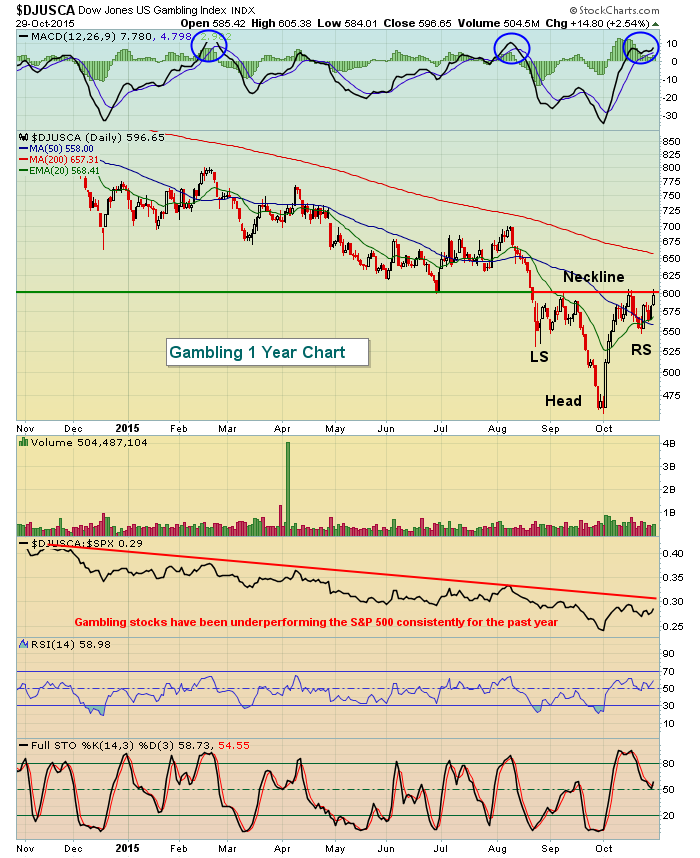
There's a lot of interest technical developments on this one chart. First, note that we're in a potential bottoming reverse head & shoulders pattern. The neckline of this pattern also represents price resistance from the broken support that had previously been established in late June near 600. There's a relative downtrend in play that indicates this has been a part of the stock market to avoid for many months. A break of this downtrend line could change that for sure. The daily MACD is behaving much more bullishly that we've seen in the past. The blue circles above show that the past two times the MACD has surged above centerline resistance, momentum quickly turned sour again. This time, the MACD appears to be turning higher again. Given the improving technical conditions, I'd respect a breakout above neckline resistance as this pattern would measure to 740 in time.
Historical Tendencies
Over the past two days, I've provided annualized returns for each of the calendar days from October 28th through November 6th on both the NASDAQ (since 1971) and Russell 2000 (since 1988). Today I'm providing those same numbers for the S&P 500 (since 1950). As you can see, there tends to be bullishness across most areas of the stock market this time of year. Check out the S&P 500 annualized returns:
October 28th (past Wednesday): +135.79%
October 29th (yesterday): +82.58%
October 30th (today): +62.50%
November 2nd (Monday): +89.40%
November 3rd (Tuesday): +99.68%
November 4th (Wednesday): +37.67%
November 5th (Thursday): +66.03%
November 6th (Friday): -33.04%
Keep in mind that the average annualized return on the S&P 500 over the past 65 years is roughly 9%. From the annualized returns above, you can see that the stock market is in a very favorable historical period. While it guarantees us nothing, it's definitely an indication that probably should not be ignored.
Key Earnings Reports
(actual vs estimate):
AON: 1.24 vs 1.23
BUD: 1.02 vs 1.24
CL: .72 vs .72
COL: 1.38 vs 1.41
CVS: 1.28 vs 1.29
CVX: 1.09 vs .79
ITT: .63 vs .59
LM: .89 vs .97
MCO: 1.11 vs 1.07
MYL: 1.43 vs 1.38
PSX: 3.02 vs 2.27
STX: .54 vs .53
XOM: 1.01 vs .89
(reports after the closing bell, estimate provided):
CCJ: .24
Key Economic Reports
September personal income released at 8:30am EST: +0.1% (actual) vs. +0.2% (estimate)
September personal spending released at 8:30am EST: +0.1% (actual) vs. +0.2% (estimate)
October Chicago PMI to be released at 9:45am EST: 49.2 (estimate)
October consumer sentiment to be released at 10:00am EST: 92.5 (estimate)
Remember, halloween is about the children. Put a smile on their faces this weekend and enjoy this special day with family and friends!
Happy trading and HAPPY HALLOWEEN!
Tom


