Market Recap for Wednesday, October 28, 2015
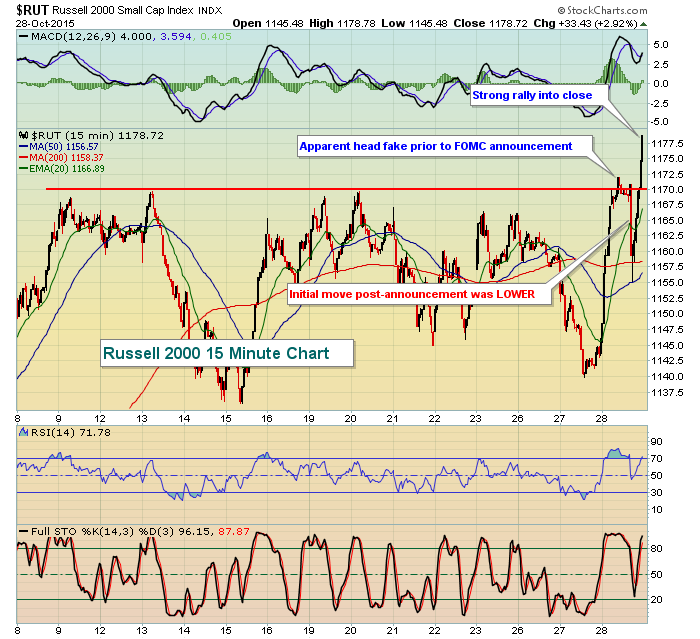
One of the most bullish historical periods of the year got off to a bullish start with the help of the Fed. But if you've been following the U.S. stock market for a few years, that was nothing new. The Fed has had the back of Wall Street for years. In fact, central bankers around the globe have been supporting the bullish argument and it's not likely to change anytime soon. All of the U.S. indices were higher prior to the FOMC announcement on Wednesday. When the announcement of no rate hike hit the Street, there was a quick selloff, then strong rally into the close - quite the opposite of what we saw on September 17th after the FOMC reached a similar conclusion. If you recall, we had significant volatility then with our major indices surging soon after the announcement, only to collapse into the close. The bulls certainly preferred yesterday's action. Take a look at the Russell 2000's intraday chart:
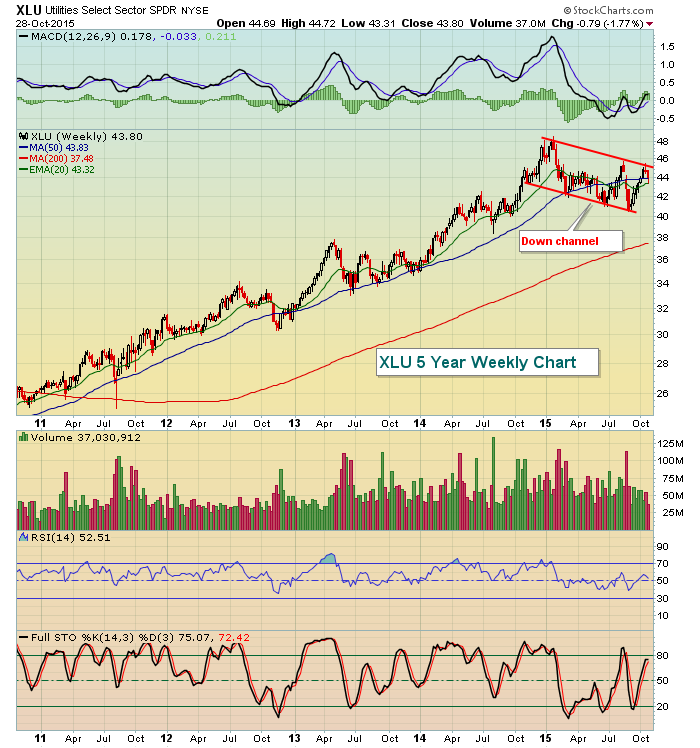
Performance of our various sectors points to higher treasury yields and a strengthening economy. Consumer discretionary (XLY) broke out to new 2015 highs as traders are clearly anticipating better economic conditions ahead. Financials were the best performing sector on the day with interest-sensitive industry groups surging higher. Banks, investment services, asset managers, and insurance companies all jumped 3% or more. Meanwhile, those most negatively impacted by higher treasury yields fared much worse. REITs badly lagged within the financial sector and utilities were down on the session - by far the worst performing sector. The selling in the XLU came as that sector was testing key price resistance and the upper end of its down channel. Take a look:
All in all, behavior on Wednesday supports the theory that we remain in a 6 1/2 year bull market and are poised to breakout to fresh highs on our major indices in the not-too-distant future.
Pre-Market Action
The biggest short-term issue the stock market faces is that it's very overbought. The Russell 2000 is the only of our major indices with RSIs not at or near 70 and with stochastic readings below 90. In addition, both the XLY (consumer discretionary) and the XLK (technology) - two of our aggressive sectors - printed 2015 highs at Wednesday's close with overbought oscillators as well. Financials (XLF) and industrials (XLI) seem to have more upside potential near-term based on their momentum oscillators.
U.S. futures suggest we'll see some profit taking in early action. The initial support level to watch will be the rising 20 hour EMA on the Russell 2000 hourly charts as its 60 minute MACD shows strong momentum. The S&P 500, however, has a negative divergence in play on its 60 minute chart, suggesting a possible trip to test its rising 50 hour SMA to reset its MACD near centerline support. Check it out:
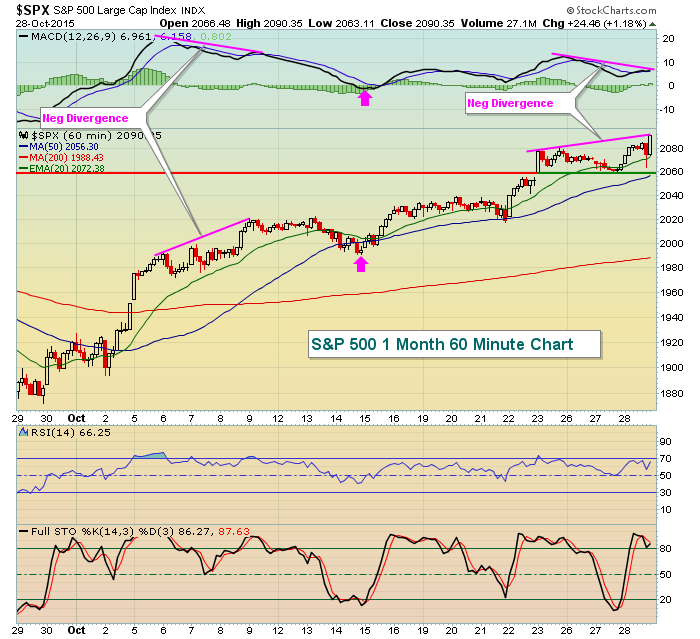
The last 60 minute negative divergence occurred earlier in October and you can see what transpired afterwards. We saw both a 50 hour SMA test, along with a MACD centerline test. Therefore, on any extended selling, I'd look for the 2060 area to provide some support.
Current Outlook
More important than the final surge in small caps yesterday was the fact they finally showed some life on a relative basis. They were underperforming in a big, big way prior to Wednesday's action, but they approached major relative support from the current bull market. I believe Wednesday's action signals a short-term relative bottom in the Russell 2000. Here's a longer-term chart of how the Russell 2000 has performed vs. the S&P 500 and why I expect to see a rebound in small cap shares:
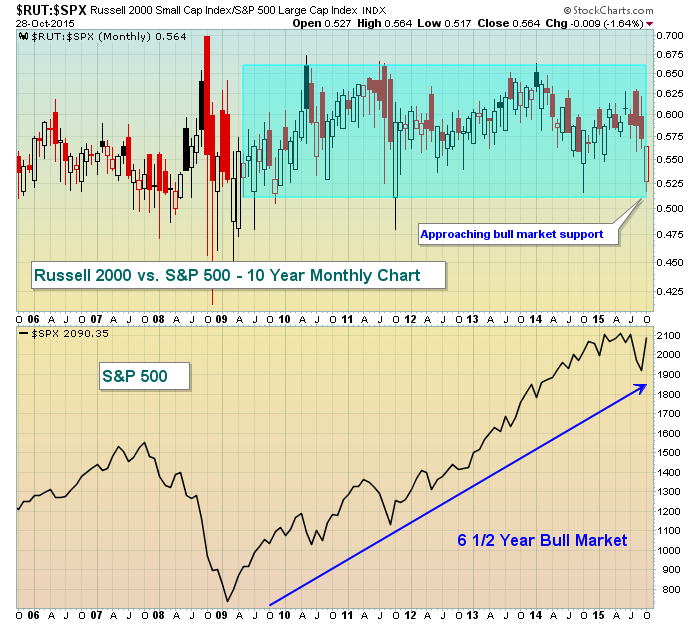
The blue shaded area above represents the relative performance of small caps vs. the benchmark S&P 500 throughout this bull market. A breakdown would be indicative of a major change in traders' attitude towards the more aggressive stocks - not a good thing when evaluating the health of a bull market. But at least temporarily, this key relative support held.
Another positive on Wednesday was the selling of treasuries. That resulted in the 10 year treasury yield rising more than 6 basis points - its strongest rise in six weeks. Proceeds from the selling of treasuries is then available to drive equity prices higher. It's just a start, but given the positive divergence in play and the corresponding surge in small caps and financials, the market is suggesting this rise in yields is just beginning. We'll need to clear trendline resistance as reflected on the following chart:
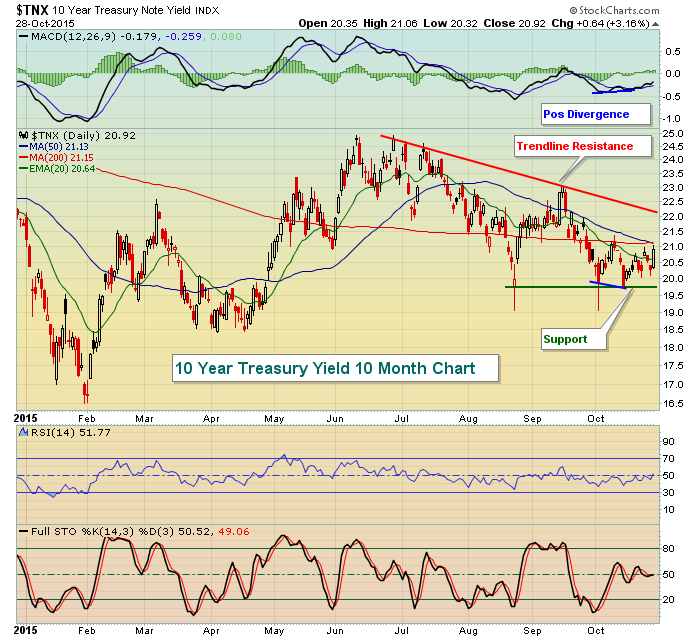
In addition to actual price gains of late and clearing key price resistance, intermarket conditions seem to be changing in a meaningful and bullish way as well. We'll need to see this continue.
Sector/Industry Watch
Another relative indicator that I review frequently to gauge the temperature of traders is the ratio of consumer discretionary (XLY) stocks to its consumer staples (XLP) counterparts. The rationale is quite simple. In a strengthening economy, products that people WANT (discretionary) sell much better than when the economy is poor or weakening. In that case, people hunker down and avoid unnecessary expenditures - but they still buy soap and deodorant (hopefully). The S&P 500 rises when traders are expecting an improving economy and higher profits. That same scenario should lift the XLY:XLP ratio. Therefore, I constantly compare the two to determine if an equity rally is sustainable or if we should be cautious. This ratio has remained bullish, even while we saw the S&P 500 experience its latest correction. Here's the chart to illustrate:
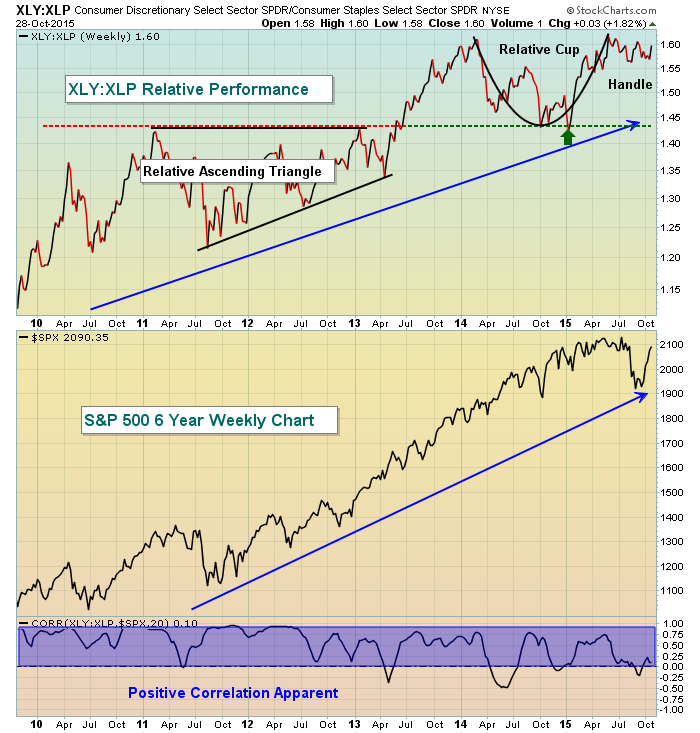
It's fairly obvious that the S&P 500 has been rising the past six years and that the XLY:XLP has followed suit. But it's not a perfect positive correlation as you can see brief dips into negative territory. That typically happens as the gains in consumer discretionary are consolidated. You can see both ascending triangle and cup with handle patterns on the relative chart. In the case of the former ascending triangle pattern, the difference between the high and low was roughly .20 (the measurement). On the breakout above 1.42, the measurement is added and the target becomes 1.62, which is the high achieved in the ratio in the second quarter of 2015. Note also that a cup with handle has now formed with the low of the cup testing relative support (TA 101 teaches us that broken resistance becomes support). Another breakout would measure to 1.82 and if that occurs expect to see a much higher S&P 500.
Historical Tendencies
Yesterday, I provided the annualized returns on the NASDAQ of the next ten calendar days based on performance since 1971. Today, I'm providing the annualized returns of those same ten days for the Russell 2000 (since 1988):
October 28th (yesterday): +180.97%
October 29th (today): +89.35%
October 30th (Friday): +20.64%
November 2nd (Monday): +153.25%
November 3rd (Tuesday): +144.93%
November 4th (Wednesday): +47.77%
November 5th (Thursday): +26.77%
November 6th (Friday): +44.03%
The trends are obvious, but like the last bearish period, they don't always work. Still, it's clear that the bulls have historical tail winds on their side through the end of next week.
Key Earnings Reports
(actual vs estimate):
AET: 1.90 vs 1.78
APD: 1.82 vs 1.80
CME: 1.02 vs .98
COP: (.38) vs (.38)
GT: .99 vs .98
HAR: 1.48 vs 1.41
JCI: 1.07 vs 1.01
LLL: 2.09 vs 1.80
MA: .91 vs .88
MCK: 3.31 vs 2.96
MO: .75 vs .75
MWW: .09 vs .08
NOK: .09 vs .08
POT: .34 vs .38
SHW: 3.97 vs 3.89
TWC: 1.62 vs 1.55
(reports after the bell today - estimate provided):
BIDU: 1.23
DECK: 1.07
EA: .33
EXPE: 1.91
FSLR: 1.54
LNKD: (.32)
SBUX: .44
Key Economic Reports
Q3 Advanced GDP released at 8:30am EST: +1.5% (actual) vs. +1.7% (estimate)
Initial jobless claims released at 8:30am EST: 260,000 (actual) vs. 265,000 (estimate)
September pending home sales to be released at 10:00am EST: +1.0% (estimate)
Happy trading!
Tom


