Market Recap for Friday, October 30, 2015
It was a lacklaster day for equities until a late day selling binge. U.S. treasuries were bought on Friday after a couple weeks of selling and that sent yields slightly lower and weighed on the financial sector, banks ($DJUSBK) in particular. Technically, banks had recently broken above 20 day EMA resistance and that's now been holding as support on recent selling episodes. As we begin a new week, we'll once again be looking for support from this influential industry group as it approaches its rising 20 day EMA. Check out the chart:
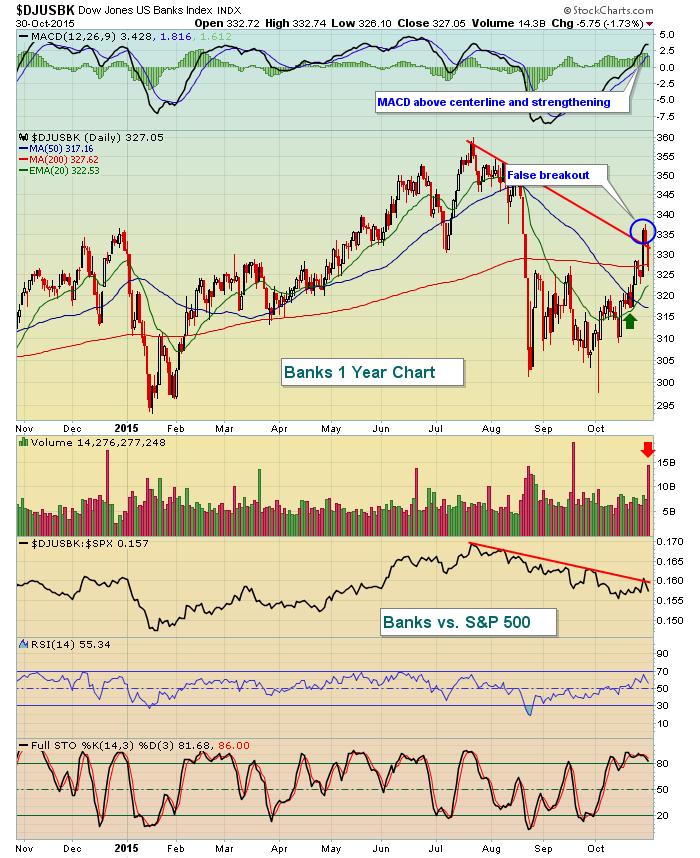
There are a few positives in banking, but also negatives - similar to the market overall. The relative weakness is obvious over the past three months and it's never a good thing to see banks underperforming the S&P 500. But banks did enjoy a relative uptrend for months prior to the recent weakness. Late last week, banks were poised to break their downtrend line. That turned out to be a false breakout, at least for now, as selling resumed with increasing volume on Friday (red arrow). October's strength saw bank prices rise back above its 20 day EMA and its 20 day EMA crossed back above its 50 day SMA (golden cross). While the conditions are currently mixed, holding the 20 day EMA and breaking its relative downtrend are the two most important short-term developments needed for banks to reestablish the leadership they enjoyed in the first half of 2015.
Despite the late day selling on Friday, four sectors did remain in positive territory, led by energy and utility shares.
Pre-Market Action
Asian markets finished lower overnight as China's manufacturing PMI came in slightly below expectations. However, economic news in Europe was better with manufacturing PMI there topping expectations. They seemed to offset one another and U.S. futures moved back and forth above and below the flat line in early morning trade. At last check, futures were positive with earnings overall fairly solid this morning, especially from Cardinal Healthcare (CAH), which not only reported results - revenues and earnings - that topped forecasts, but also raised future guidance. Also aiding equities this morning is the early selling of treasuries. On Friday, as mentioned above, banks and other financial stocks struggled with the 10 year treasury yield ($TNX) falling. All of those losses in the TNX have been recovered this morning so it'll be interesting to see if financials regain their leadership role.
Current Outlook
As we start a new trading day, week and month, it's a good time to take a step back and look at a long-term weekly chart to put all of the recent volatile action in perspective. After our last correction in 2011, the S&P 500 gained 75% in three years. That's a very significant outperformance over historical norm (9% per year since 1950). While we all would like to see that type of performance every year, it's unrealistic. The U.S. stock market was in NEED of a period of consolidation - even a correction - to base for awhile in order to extend the current bull market. There are certainly mixed signals and enough information for each of us to support our own bull/bear market theories. Just keep in mind key areas of price support and resistance to draw your line in the sand in the event your theory proves incorrect. The bull market channel higher has been in play for six years and the October price low on high volatility marks a significant bottom in my opinion. Violation of that support level gives much more weight to the notion of this being a bear market. But the intermarket areas that I follow most closely to determine whether a bull market is sustainable remain mostly intact. That's why I maintain my longer-term bull market call. But as you can see below, there is room on this long-term weekly chart to digest a period of sideways, or even declining, prices:
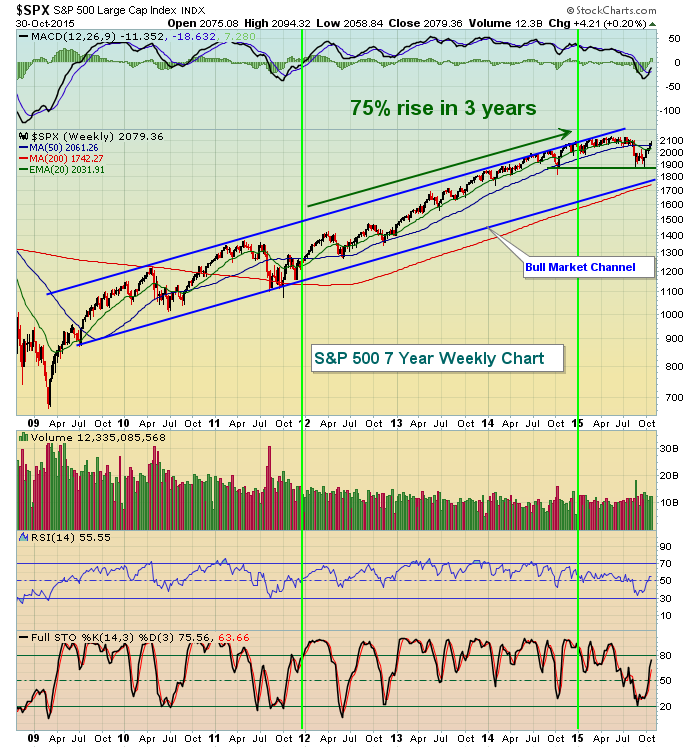
It's easy to get caught up in the day-to-day emotions of a market that can't seem to make up its own mind. That's why calling the stock market on a daily basis - or even weekly/monthly - is so difficult. While reviewing long-term charts may not help you make a better trade today, hopefully it will keep us all somewhat grounded when listening to the daily scarefest on CNBC and elsewhere.
Sector/Industry Watch
Paper stocks used the strength in October to completely turn the tables on bears in the industry. The downtrend was obvious and its recent rally has thrust it into a position of challenging key price resistance while attempting to hold onto rising 20 day EMA support. The range is narrowing, as reflected below:
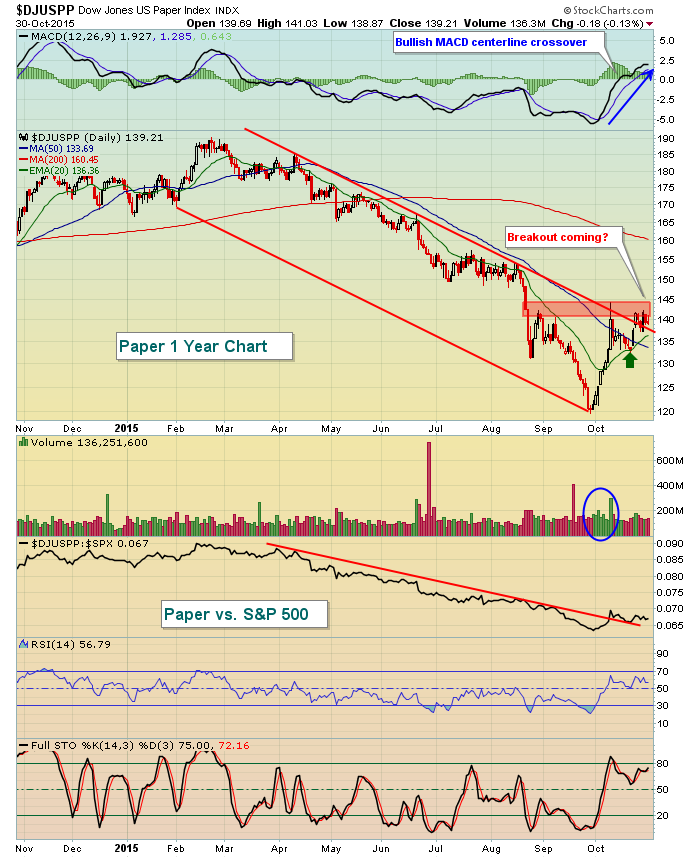
Volume trends have improved greatly and the MACD has crossed its centerline, indicative of strengthening momentum. The downtrend line relative to the S&P 500 has also apparently been broken. The green arrow marks not only 20 day EMA support, but also a possible reverse right shoulder. The low in August would represent the reverse left shoulder. But price/neckline resistance must be negotiated (red shaded area) to confirm all the other bullish developments.
Historical Tendencies
Mondays have historically been the weakest day of the week, but they do generally perform better during bullish periods of the calendar month - like our current October 28th-November 6th bullish period. Futures are currently pointing higher so perhaps this Monday will be a bright one for the bulls.
Key Earnings Reports
(actual vs estimate):
CAH: 1.38 vs 1.10
CLX: 1.32 vs 1.18
EL: .82 vs .69
SYY: .52 vs .52
V: .62 vs .62
(reports after today's closing bell, estimate provided)
AIG: 1.05
DNB: 1.67
FIT: .05
VNO: 1.25
Key Economic Reports
October PMI manufacturing index to be released at 9:45am EST: 54.1 (estimate)
October ISM manufacturing index to be released at 10:00am EST: 50.0 (estimate)
September construction spending index to be released at 10:00am EST: +0.4% (estimate)
Happy trading!
Tom


