Market Recap for Monday, October 26, 2015
Relatively speaking, there was little volatility in U.S. equities on Monday as each of our major indices showed minor gaps at the open and then traded within Friday's trading range. In other words, we didn't see any higher highs or lower lows from Friday's action as the market treaded water awaiting a big earnings report from Apple (AAPL). It's big primarily for the health of the NASDAQ and NASDAQ 100. That's where we've seen significant relative outperformance of late in technology and other heavily weighted areas of the NASDAQ. Of note on Monday, however, was the poor performance of computer hardware ($DJUSCR) shares, the industry group home of AAPL. To me, it looks like nothing more than a pullback off of recent gains to test the rising 20 day EMA. Have a look and see what you think:
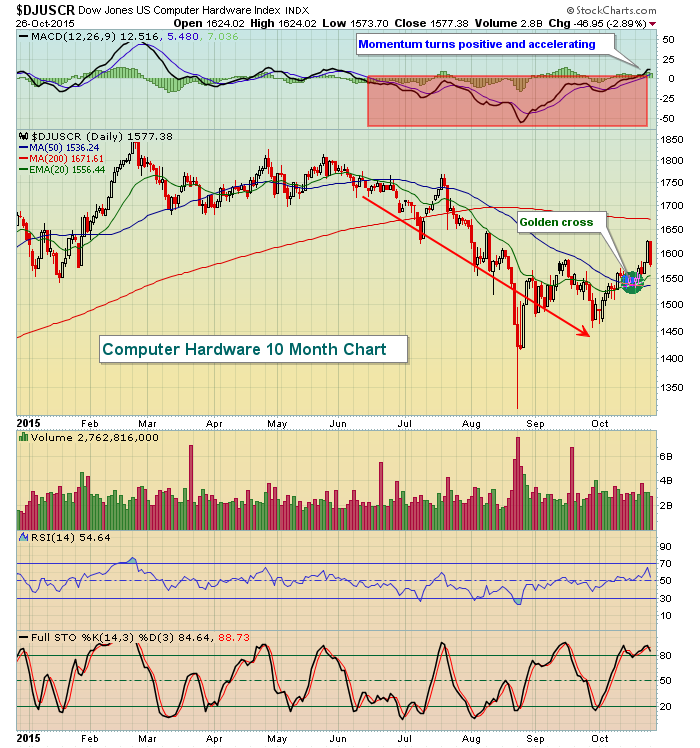
There have been a couple positive technical developments of late. First, note that price action has turned higher after the steady recent decline. That generated a "golden cross" where the short-term moving average clears the longer-term moving average - in this case the 20 day over the 50 day. Recent selling episodes have been bouncing at rising 20 day EMA support - another positive sign. Finally, after a few months of negative momentum (red shaded area where MACD resided below centerline), computer hardware now shows positive and accelerating momentum to the upside. So AAPL will have its chance later today to extend this advance. Unfortunately, AAPL also could be the goat as a potential island reversal exists. Check out this chart of the NASDAQ:
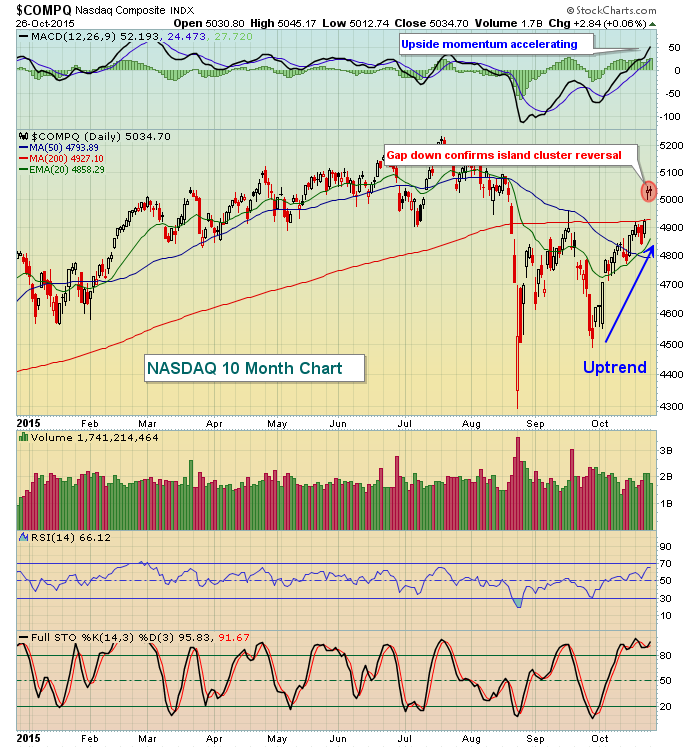
A gap higher after AAPL's results would likely send the NASDAQ into overbought territory while a gap down would confirm an island cluster reversal. In either case, the major technical test now comes on any selling down to test the rising 20 day EMA. An uptrend should hold that moving average. Stay tuned.
Consumer discretionary led the action on Monday as it was the only sector that produced gains of any significance (+0.70%). Seven of the nine sectors were lower, clearly led by energy (XLE -2.45%) once again. The energy ETF (XLE) is backing off 20 week EMA resistance and its chart is covered below in the Sector/Industry Watch section of today's article.
Pre-Market Action
U.S. futures are down slightly following the lead of European indices. I've pointed out in prior articles that the S&P 500 ($SPX) has a tight correlation to the German DAX ($DAX) so it's noteworthy that the DAX has cleared short-term price resistance with momentum (MACD) accelerating to the upside. Here is the current technical state of the DAX, in my view:
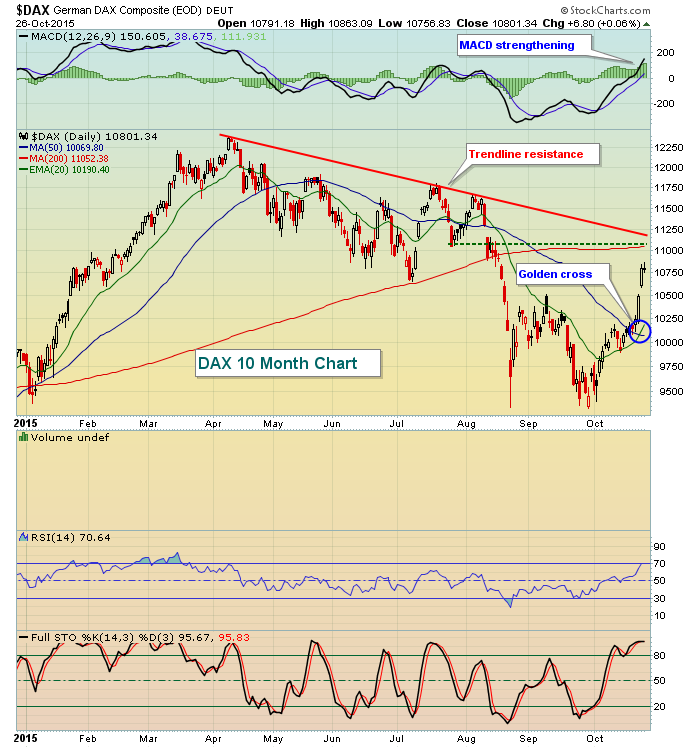
Now that the MACD has crossed above centerline resistance and is accelerating, I'd want to see any pullback hold rising 20 day EMA support, currently at 10190. To the upside, it appears the DAX is heading for a test of trendline resistance near 11200. That's the range for now and so long as support holds, my strategy would continue to treat this as a bull market, entering positions on weakness at 20 day EMA support.
Current Outlook
The U.S. market outlook has improved, especially given the strength in prices over the past week during what normally is a very bearish period. This strength has enabled most major indices and sectors to clear important short-term price and moving average resistance that generally is not cleared during the beginning of bear markets. Of course, the stock market can do whatever it wants. It's not guaranteed to be directed by history, technical conditions, etc., but as a technical trader I am interested in probabilities and managing risk. That's why technical conditions and history become so important to me.
Tons of key earnings reports will be out over the next two weeks. You can see from the list of Key Earnings Reports below that the number of critical earnings reports is accelerating. How the stock market reacts to these reports and where we stand technically in 1-2 weeks will help us to determine whether we are breaking out of the recent correction or whether this is simply a bounce in a more protracted correction or even bear market. In my opinion, the odds are already pointing to the former.
Sector/Industry Watch
Energy (XLE) was showing signs of life recently on its daily chart, but crude oil has been dropping again and the XLE is turning down at key 20 week EMA resistance. Very positive longer-term technical conditions could mark a potential bottom at key price support on another price low. Check this out:
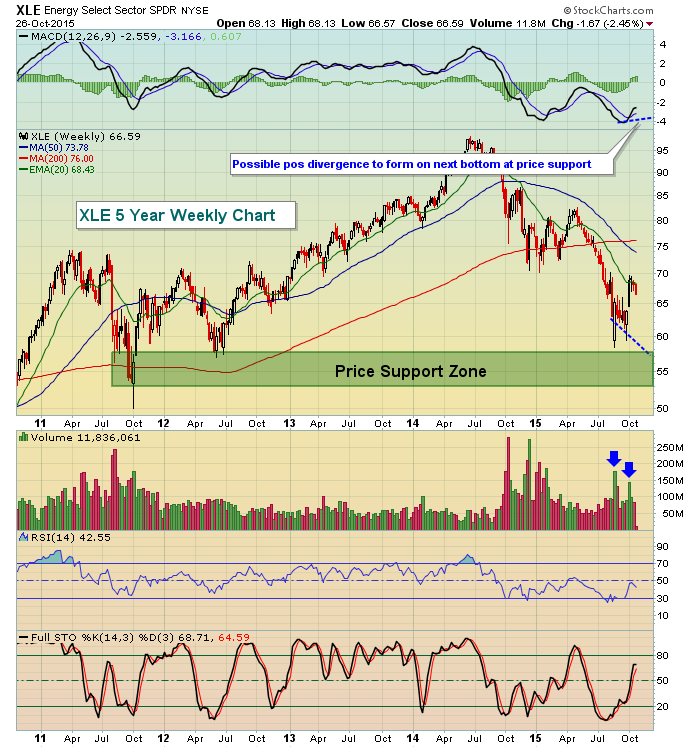
Part of technical analysis is anticipating certain conditions. Should the XLE fall further to close at recent lows, there's a strong probability of a positive divergence forming on the MACD just as key price support is tested. That would produce a very solid reward to risk entry into this ETF. The blue arrows suggest we're beginning to see a bit more interest on the recent strength, although to be honest, I generally don't follow volume trends nearly as closely on ETFs as the price of the ETF is driven by its basket of stocks, not necessarily the demand suggested by the ETF volume itself.
Historical Tendencies
The Russell 2000 has been underperforming on a relative basis for the past several months, but there's good historical news ahead for small cap stocks. December represents BY FAR the best calendar month of the year for small caps. I wouldn't be surprised by relative outperformance by the Russell 2000 in the weeks ahead, particularly as we move in December in roughly five weeks. More on that December relative outperformance later during November.
Key Earnings Reports
(actual vs. estimate):
BABA: .57 vs .54
BMY: .96 vs .91
CMCSA: .80 vs .80
CMI: 2.14 vs 2.59
DD: .13 vs .11
F: .45 vs .46
MRK: .96 vs .91
NVS: 1.27 vs 1.31
PFE: .60 vs .51
UPS: 1.39 vs 1.37
(reports after today's close, estimates shown below):
AAPL: 1.88
AFL: 1.48
AKAM: .47
APC: (.72)
ESRX: 1.44
GILD: 3.03
PNRA: 1.31
SKYW: .66
TWTR: (.25)
Key Economic Reports
September durable goods released at 8:30am EST: -1.2% (actual) vs. -1.0% (estimate)
September durable goods excluding transports released at 8:30am EST: -0.4% (actual) vs. -0.1% (estimate)
August Case-Shiller home price index to be released at 9:00am EST: +0.1% (estimate)
October PMI services to be released at 9:45am EST: 55.3 (estimate)
October consumer confidence to be released at 10:00am EST: 102.5 (estimate)
FOMC meeting begins with announcement Wednesday 2pm EST
Happy trading!
Tom


