Market Recap for Friday, October 23, 2015
Huge earnings reports from the likes of Amazon.com (AMZN), Alphabet (GOOGL) and Microsoft (MSFT), among others, sent NASDAQ 100 shares flying higher on Friday, far outpacing the broader stock market. For the week, technology and industrial shares rose 4.43% and 4.02%, respectively, to power U.S. equities to fresh recent highs. It wasn't a broad market advance, however, as three sectors - utilities, healthcare and energy - all finished lower for the week. Bifurcation was the name of the game. Software ($DJUSSW) led the technology sector, gaining 5.39% to break out to a new high. Take a look at this breakout on the DJUSSW weekly chart:
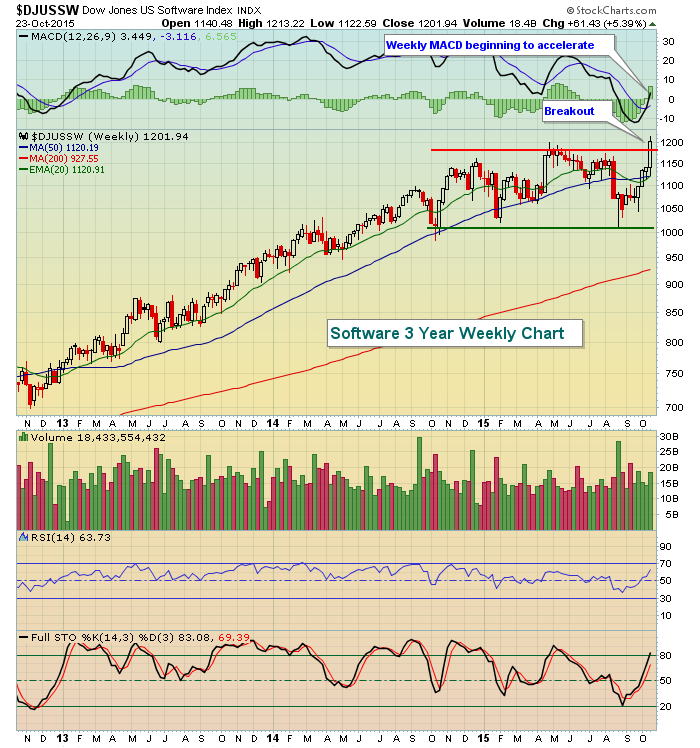
Volume was again strong to support this move higher in price as NASDAQ volume totaled 2.15 billion while S&P 500 volume came in at 2.8 billion - both strong relative to average volumes throughout 2015. The combination of price breakouts and confirming volume is THE most important indicator in my view so I am respecting the action from last week.
Pre-Market Action
U.S. futures are close to the flat line this morning although they've been negative throughout the morning. Asian markets were mixed and the key European markets are mixed as well - fractional gains and losses everywhere. There is little economic news today, with new home sales hitting the wires at 10am EST. As a reminder, home construction stocks ($DJUSHB) remain in a very bullish long-term continuation pattern (breakout from an ascending triangle). I expect to see higher prices from this group in time. Here's the current chart:
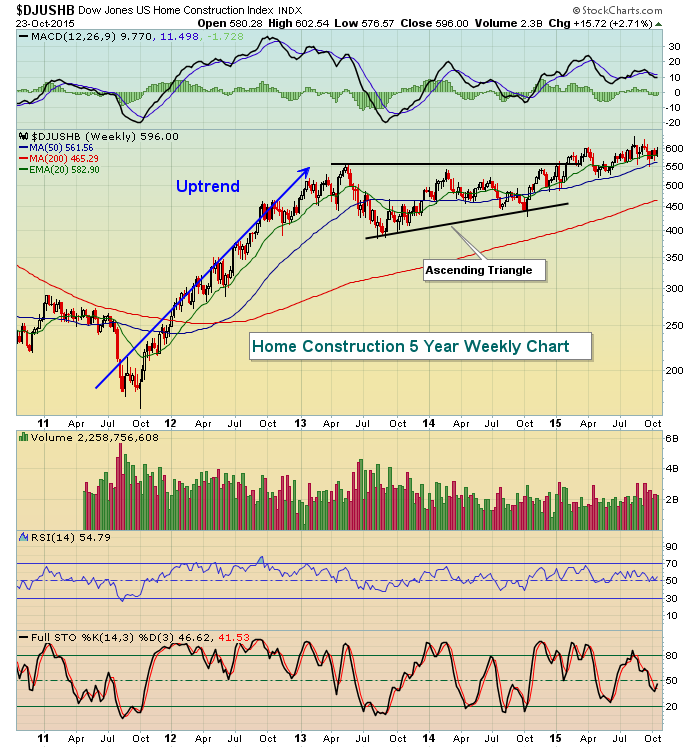
Once broken, ascending triangles "measure" the distance from the top of the triangle to the bottom. In this case, from 550 down to 390, or 160 points. So we take the breakout level of 550 and add 160 points and we get a measurement or target of 710. Currently, the DJUSHB trades at 596 so there's plenty of upside left here.
Current Outlook
I continue to maintain my belief that the recent weakness was a deep correction and that the bull market lives on. The action from last week, clearing key levels of price resistance, would confirm that. We can never be sure of market direction as bear markets can begin in a variety of ways and take on many shapes and forms. There are still warning signs, despite the bullish price/volume action from last week. For instance, there's been little relative interest in small cap stocks as the Russell 2000 has been badly underperforming its larger counterparts for months. Last week I showed a relative performance chart of the Russell 2000 vs. the S&P 500 ($RUT:$SPX). Now let's compare small caps to the NASDAQ 100. Check out this chart:
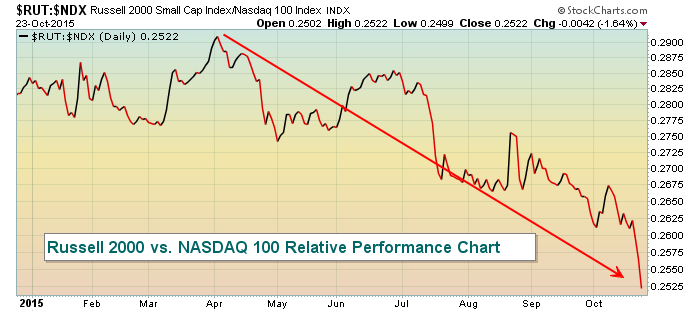
It's difficult to explain the rationale behind this relative plunge as the Russell 2000 is being shunned. This index is comprised of small cap companies that do nearly all of their business in the U.S. The Federal Reserve has led us to believe that global economic weakness is the key uncertainty. However, this chart suggests there's more of an issue right here at home. Another possibility could be that traders view the increasing quantitative easing as a sign to invest more money outside the U.S. to take advantage of this more global QE program. No matter how you view it, the key takeaway is that, for now, small cap stocks are at a major technical disadvantage.
Sector/Industry Watch
In recent weeks, we've seen industrials beginning to gain strength. I've provided charts on many industry groups within the industrials space, including airlines, defense, aerospace, etc. Let's talk about another - delivery services ($DJUSAF).
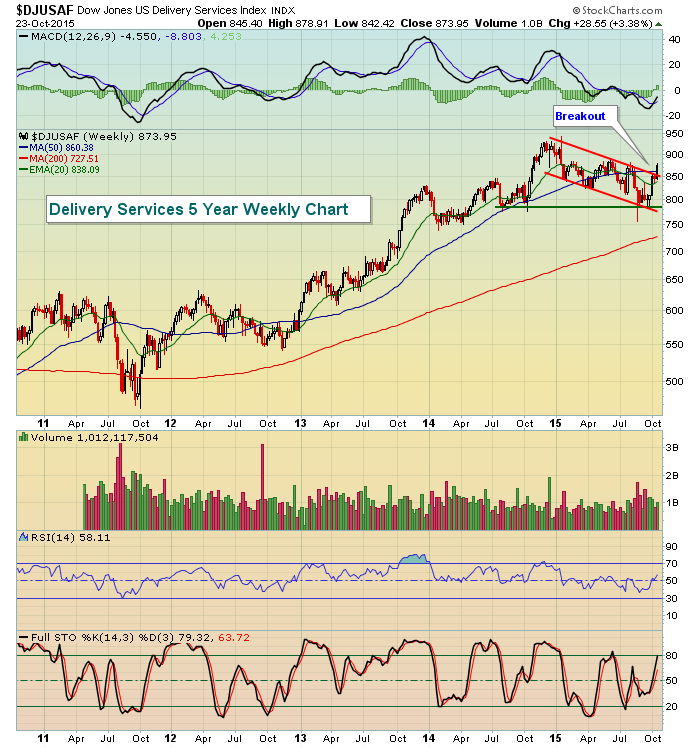
Bull markets are all about sector and industry group rotation. After a stellar move higher in late 2014, the DJUSAF fell back to price support in a channel throughout most of 2015. That down channel now appears to have broken so I'd expect this industry group to outperform in the weeks and months ahead.
Historical Tendencies
I've discussed the possible implications of the current bearish historical period for the past week, with little to show for it. Major indices, though somewhat bifurcated, have continued to push forward, especially on the NASDAQ 100 where several tech giants had blowout earnings reports last week. If the bulls can maintain the upper hand over the next couple days, history turns much more bullish. In fact, the S&P 500 has moved higher roughly 86% of the time from the October 27th close to the January 19th close. This stat covers 65 years of S&P 500 action since 1950.
Key Earnings Reports
(actual vs. estimate):
TREE: .79 vs .52
XRX: .24 vs .22
(reporting after today's close so only estimate provided):
BRCM: .73
IACI: .73
Key Economic Reports
September new home sales to be released at 10:00am EST: 549,000
Happy trading!
Tom


