Market Recap for Tuesday, October 27, 2015
It was a rather non-eventful day on Tuesday with our major indices in negative territory throughout much of the day. There was a bit of bifurcation once again as the NASDAQ 100 finished in positive territory while the Russell 2000 once again lagged badly. The Dow Jones and S&P 500 were lower after a bit of strength in the early going, but the losses were contained and none of the moves down were of the impulsive variety. All in all, not bad action to close out the worst historical week of the year. This may come as a surprise to those who haven't really followed small caps, but the Russell 2000 was just flat during this past week.
Healthcare was the only sector to perform well on Tuesday as the XLV gained 1.84%, led by the Dow Jones U.S. Biotech Index ($DJUSBT), which climbed 2.78% and was able to close above its 50 day SMA for the first time since August 17th. Take a look at the renewed technical strength:
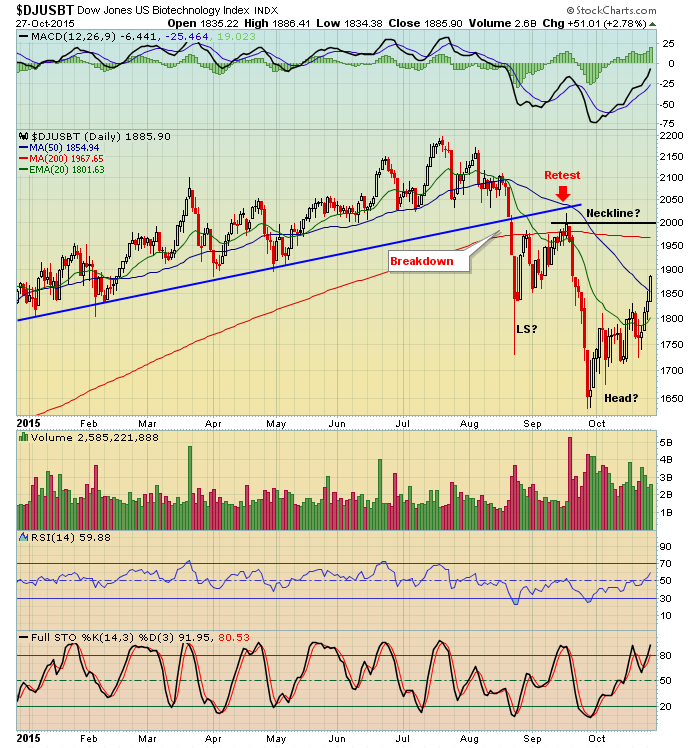
A few technical notes here:
(1) The bullish trendline was broken in late August and we saw a retest of that breakdown on the September reaction high.
(2) The subsequent breakdown in the latter part of September occurred on very heavy volume, a "must respect" signal.
(3) Unlike the September recovery, this latest move higher is accompanied by solid volume - an important change that improves the odds of continuance.
(4) Tuesday this group closed above its 50 day SMA for the first time since August 17th.
(5) This COULD represent an inverse head & shoulders pattern that would be extremely bullish on a longer-term chart. Just keep in mind these types of patterns do not confirm until the entire pattern prints and we see a heavy volume breakout. There's much work to do.
Given the improving technical conditions, it's worthwhile to take a step back and look at the bigger picture to see if this potential pattern makes sense. Here's the longer-term weekly chart of the DJUSBT:
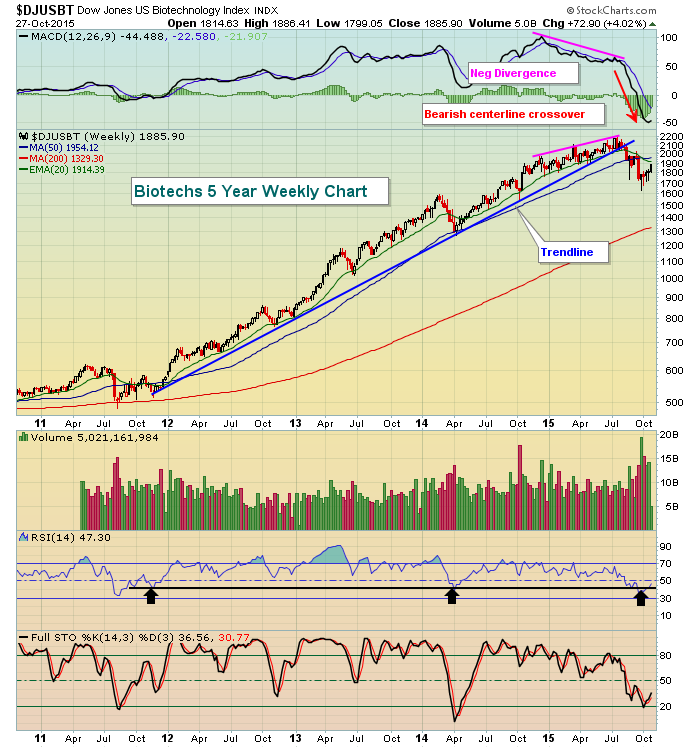
A few more technical notes after looking at this longer-term picture:
(1) Regardless of which side you're on - long or short - you need to recognize the developments that would likely prove your theory wrong.
(2) The price and trend breakdown, along with the loss of MACD centerline and RSI 40 support is all fairly obvious and these are all bearish developments.
(3) If the recent low has printed the head of an inverse head & shoulders pattern, that low should not be violated and is MAJOR support.
(4) If price action continues to move higher to put in the right side of the neckline, then it will need to clear the declining 20 week EMA (significant resistance in a long-term decline, especially with the MACD so bearish), currently at 1914. It will also need to clear the 50 week SMA, which is at 1954.
We don't know which way this industry group is heading, but action over the next few days to few weeks should provide us more clues as to the longer-term direction. If you're trading on either side, just make sure to keep your stops in place.
Pre-Market Action
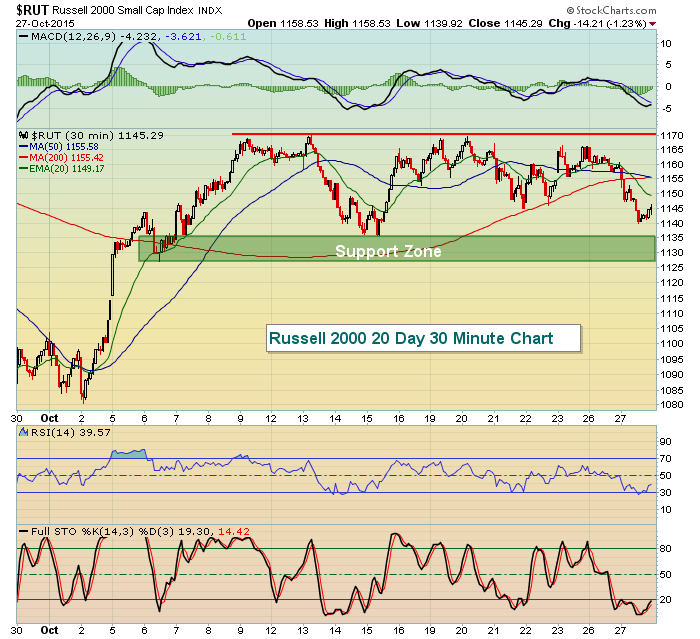
I would expect that action will be relatively subdued today as traders anxiously await the FOMC's latest comments. It's difficult to assume what will happen after Fed Chief Yellen threw everyone a curve ball on September 17th. Are global uncertainties still on the top of the FOMC's "watch list"? Or will they provide more insight into our own domestic issues? If there are any positive comments made about the U.S. economy, I'd expect to see a bullish reaction in the Russell 2000, which has performed horribly of late. A recent chart of the Russell 2000 is provided below.
Futures are slightly higher as we await the beginning of a big day in terms of reactions to the FOMC.
Current Outlook
The bulls are definitely flexing their muscles and after a very influential earnings report from Apple (AAPL), the bulls look to remain in charge this morning. Throw in the fact that historical headwinds have now turned to tailwinds to coincide with strengthening technical conditions and it seems obvious to me that the bears will have their collective hands full. The first key technical support level will be rising 20 day EMAs. The exception is the Russell 2000, which has been extremely weak. Looking at an intraday chart, the Russell 2000 shows clear price resistance near-term at 1170 while a support zone from 1125-1135 needs to hold. Check it out:
Sector/Industry Watch
Coal ($DJUSCL) has been a very weak part of the energy sector, but pipelines ($DJUSPL) has been a close recent second. In the last week alone, the DJUSPL has fallen more than 10% and it's difficult to make a bullish argument on the long-term weekly chart. Take a look:
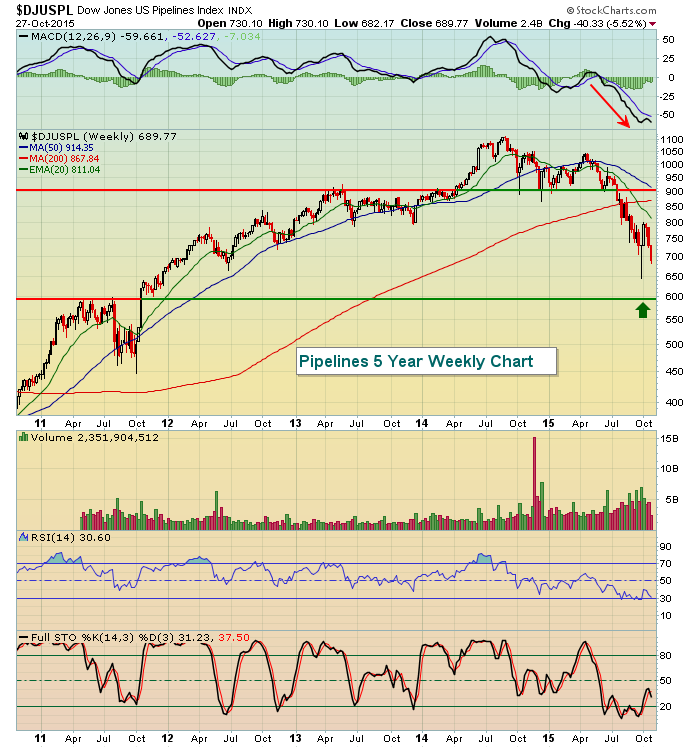
Momentum remains weak and there's not really a positive divergence on the weekly chart yet, so it's difficult to predict a bottom until perhaps price support closer to 600 is tested.
Historical Tendencies
Since 1971, here are the annualized returns for the NASDAQ for each of the following calendar days:
October 28th (today): +176.98%
October 29th (Thursday): +79.72%
October 30th (Friday): +38.83%
November 2nd (Monday): +140.88%
November 3rd (Tuesday): +97.89%
November 4th (Wednesday): +78.45%
November 5th (Thursday): +101.13%
November 6th (Friday): +17.78%
The bears will have their work cut out for them - at least from a historical perspective.
Key Earnings Reports
(actual vs. estimate):
ADP: .68 vs .65
GD: 2.28 vs 2.10
GSK: ?? vs .60 (reported results and trading 3.5% higher, but I haven't found a good comparable number to use for EPS)
HES: (1.03) vs (1.22)
HSY: 1.17 vs 1.12
ICE: 2.91 vs 2.92
IP: .97 vs .92
NOC: 2.41 vs 2.21
NSC: 1.57 vs 1.41
OXY: .03 vs .00
VLO: 2.79 vs 2.64
(reports after the closing bell today, estimate provided)
AEM: .01
AMGN: 2.38
BWLD: 1.27
FFIV: 1.40
GPRO: .22
MAR: .74
NEM: .19
ORLY: 2.36
PSA: 2.25
UNM: .91
Key Economic Reports
None, except that the FOMC will announce its policy decision at 2:00pm EST.
Happy trading!
Tom


