Market Recap for Wednesday, October 22, 2015
It was a very bullish kind of day. There was strength at the opening bell and outside of a brief mid-day bout of selling, buying continued through the close. Adding an exclamation point was the volume. Barring option expiration days and the panicked selling around the August lows, Thursday represented the heaviest volume day of the year on the S&P 500. It's very difficult to argue that kind of price/volume action. Two of the top three performing sectors were industrials and technology. While it would have been better to see consumer discretionary and financials up near the top as well, I'll try not to nitpick such bullish action.
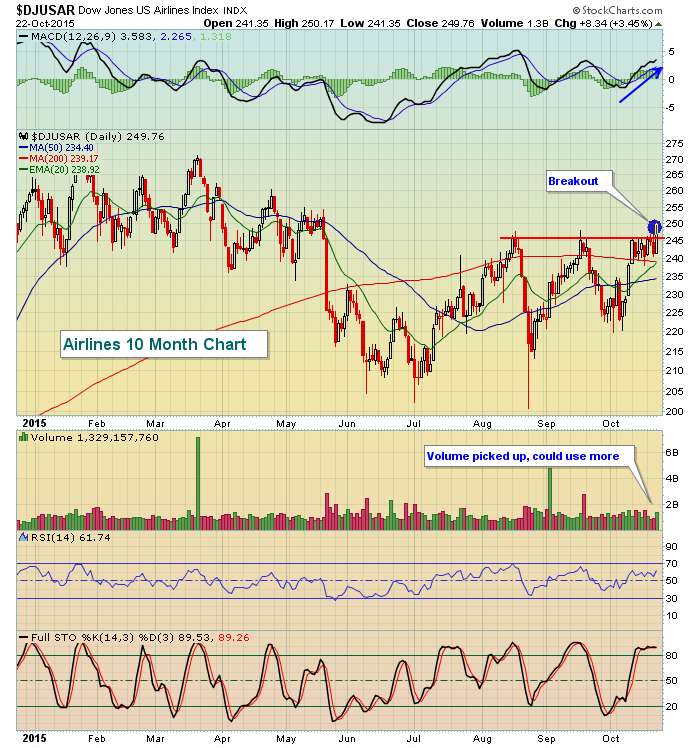
Airlines ($DJUSAR) led the industrials to big gains. This is a group I've discussed frequently in recent past and they finally made a significant technical breakout. I'd expect to see higher prices in the group in the days and weeks ahead. Check out the chart:
Healthcare providers ($DJUSHP) and Valient Pharmaceuticals (VRX) kept pressure on the healthcare sector as the XLV was the only sector ETF to finish in negative territory yesterday. Biotechs ($DJUSBT) managed to eke out gains, but still performed far worse than most industry groups in other sectors. Healthcare is just a difficult area to be invested in at this time.
Pre-Market Action
U.S. futures are soaring and extending Thursday's rout by the bulls. European Central Bank President Mario Draghi said the $1 trillion euro bond-buying program would be re-examined in December. Many traders are expecting that means further quantitative easing (QE) in Europe or at least an extension of the current program. Throw in China's announcement overnight that they're cutting interest rates and very strong earnings from Amazon (AMZN), Alphabet (GOOGL) and Microsoft (MSFT) and we seem to have a perfect storm for equities. The dovish stance of central bankers around the globe is most definitely a driving force behind the recent rally in equities and could continue to provide tailwinds for the foreseeable future.
There's very little in the way of economic news today, so the market will likely trade off of recent momentum and earnings reports, which have been mostly positive.
Current Outlook
Despite the many intermarket warning signs and the start of the single worst historical period of the year, the bulls managed to clear significant resistance on both the S&P 500 and NASDAQ - with confirming volume. As noted above, strong earnings overnight from two NASDAQ giants only look to add to the gains from Thursday so the bull market rages on. The combination of price/volume trumps everything else as far as I'm concerned so I'd be looking only for long candidates until the bears can prove to be more forceful and are able to clear key support levels to the downside. NASDAQ resistance was near 4910 and the S&P 500 had resistance in the 2040-2045 area and both were cleared yesterday. Check out the daily charts for each below:
NASDAQ:

S&P 500:
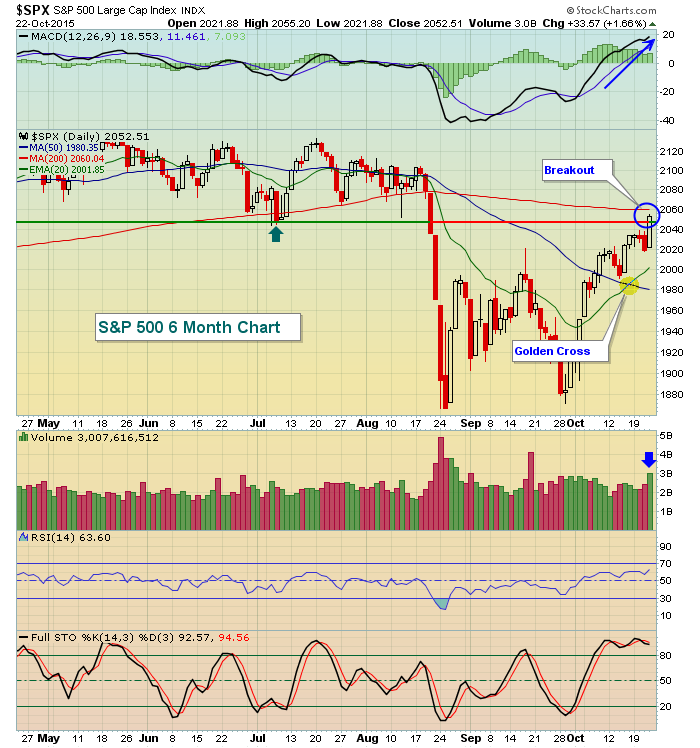
There are similarities on both charts. The breakouts above short- to intermediate-term resistance are the most significant. Expanding volume, accelerating bullish momentum (rising MACDs), support holding at rising 20 day EMAs, etc. are all pointing to a resumption of the bull market. Another positive is seeing the daily RSI push back into the 60s. During bear markets, we rarely see rallies move the RSI beyond the 50-60 range. Furthermore, the prior two bear markets never saw the Volatility Index ($VIX) move below 16-17 support at any point after the initial selling episode. On Thursday, the VIX closed at 14.45.
Sector/Industry Watch
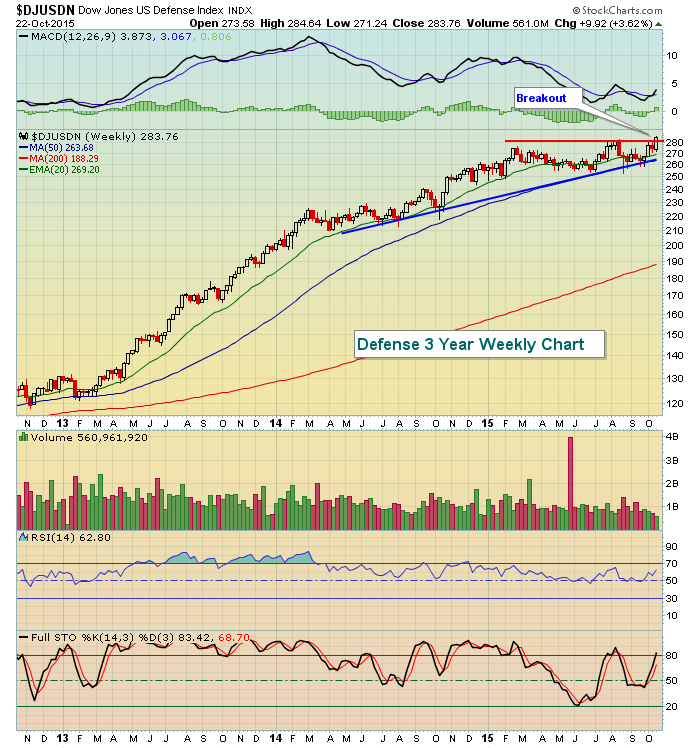
I mentioned the strength of airlines above, but defense ($DJUSDN) is also contributing to strength in industrial stocks. The chart below shows that while our major indices are simply clearing short-term resistance, the DJUSDN has surged to fresh new highs after consolidating for 8 months. With the weekly MACD just now turning higher from near centerline support, this group appears to have plenty of room to the upside. Take a look:
Historical Tendencies
The S&P 500 has historically performed very poorly from now through October 27th. This is the worst week of the year historically, though it would be difficult to see it based on yesterday's performance and the early pre-market action today. Still, here are the annualized returns on the S&P 500 for each of the days within this bearish period:
October 22 (yesterday): -107.53%
October 23 (today): -10.12%
October 26 (Monday): -40.41%
October 27 (Tuesday): -20.97%
Both October 24 and October 25 carry negative annualized returns as well: -30.36% and -60.81%, respectively. They fall on Saturday and Sunday this year, however.
Key Earnings Reports
(actual vs. estimate)
AAL: 2.77 vs 2.72
LEA: 2.56 vs 2.38
LYB: 2.80 vs 2.55
PG: .98 vs .94
RCL: 2.84 vs 2.70
STT: 1.16 vs 1.25
Key Economic Reports
October PMI manufacturing to be released at 9:45am EST: 53.0 (estimate)
Happy trading!
Tom


