Market Recap for Thursday, January 22, 2016
We saw some hesitation from small cap stocks ($RUT) to continue their relative surge from Wednesday, but other key aggressive areas of the market took over to provide hope of a continuing rally. First and foremost, however, the stock market gained relief from the energy sector (XLE) where we saw crude oil ($WTIC) climb more than 5%. That sparked the XLE to a 3.1% rise, well outperforming all other sectors - and by a wide margin. Of course, this is one beaten down sector as the chart below shows:
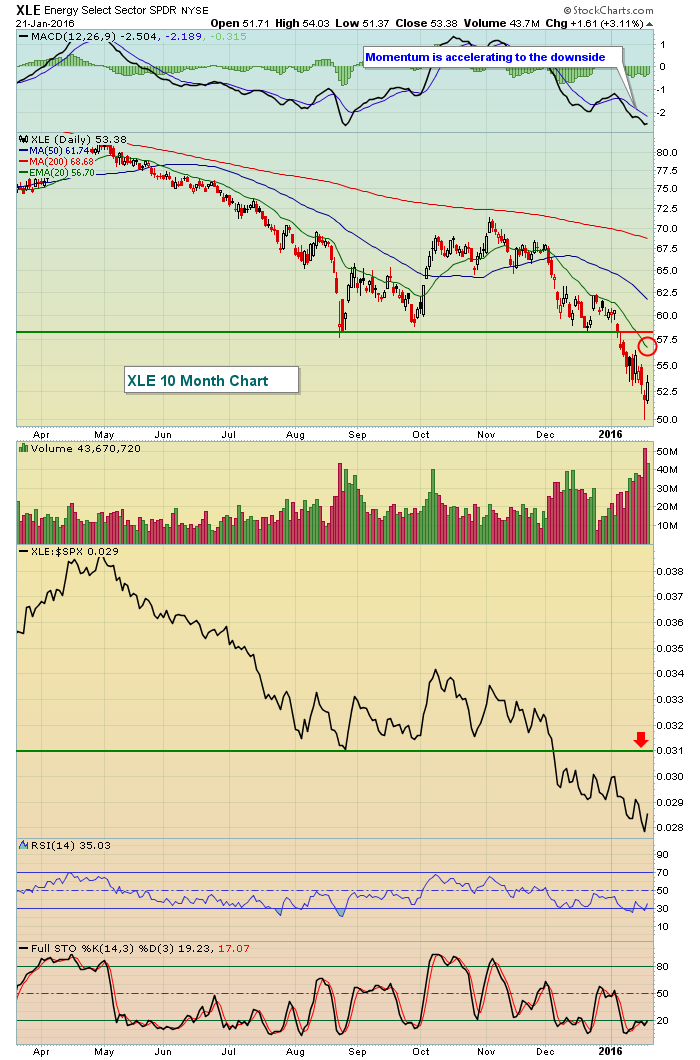 We're coming out of oversold territory, which is enabling the current bounce in the XLE. However, the daily MACD is very weak so the declining 20 day EMA (currently 56.70) will be the first key resistance level here. If the rally lasts long enough to clear that moving average, then price resistance near 58.00 would be next. I also show the XLE:$SPX relative performance and that's been abysmal. Relative strength on the XLE back to that recent breakdown at .031 (red arrow) is a possibility if the rally extends late into January or into early February.
A couple other notables from Thursday were the relative strength of consumer discretionary vs. consumer staples (XLY:XLP) and a very strong transportation group. The top of the industrial sector leaderboard was peppered with transporation industry groups (railroads again being the exception), a bullish sign in the near-term.
Pre-Market Action
Well, here comes another serious gap. This time, however, it favors the bulls. Global markets are rallying and ECB President Mario Draghi's comments yesterday has traders in a much more bullish mood. We'll see how much staying power the market shows after the open. We're in a very skittish market so don't be surprised to see a brief period of impulsive selling given the strong start to the day. Keep an eye on treasuries today. That will be another clue. A rising 10 year treasury yield ($TNX) is bullish for equities so if the TNX keeps rising, it'll help me to remain bullish near-term.
Current Outlook
We look to be in rally mode. The first step to rally mode is printing higher highs and higher lows on the daily chart and we've done that. The next key step is seeing relative strength in the areas of the stock market that truly matter during periods of strength - consumer stocks (especially discretionary), transportation stocks (relative to utilities), small cap stocks, technology and financials. Most of those areas have shown strength the past couple days for the first time in 2016.
Consumer discretionary stocks (XLY) bounced off major August support on Wednesday and then followed that up with its highest close in four days. That may not seem like much, but after the thrashing the stock market has absorbed in 2016, we'll take it. Check out the successful test of price support on the XLY:
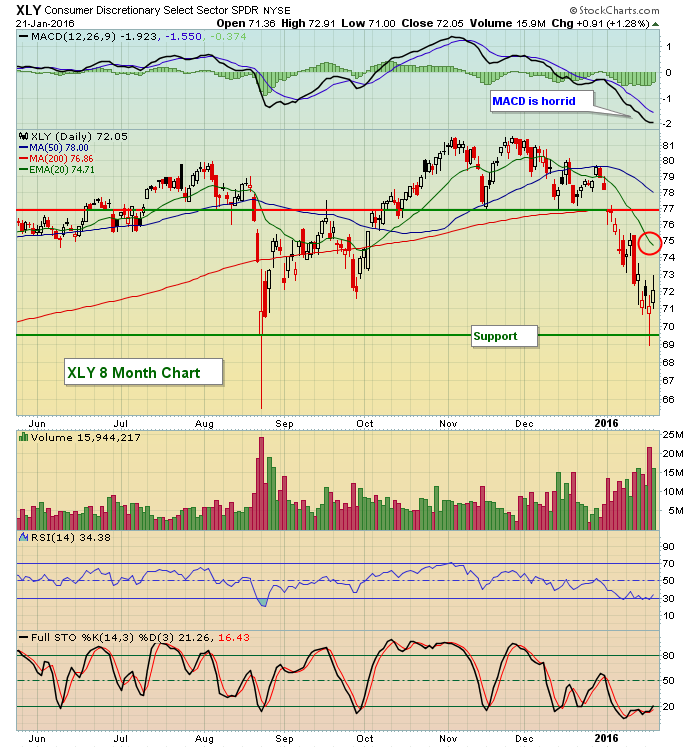 This appears to be nothing more than a short-term countertrend rally at this point. That could change, but I'm not going to go long and hope that key resistance levels are cleared. Instead, I'm going to respect them. The declining 20 day EMA should be respected. My expectation is that the 20 day EMA will be powerful resistance given the market's meltdown the past few weeks.
Here's the question on most traders' minds. How will we know when the bounce is over? This is a loaded question and one that can't be answered with certainty. But there are a few signals to watch for. The first will be volume. Heavy volume will provide a better chance for further strength. The second will be leadership. In other words, as we rise further and further, does the leadership again turn to defensive areas of the market? If so, I'll move back to cash. No chances here. If the stock market refuses to take big risks, then why should I? To a lesser degree, I'll be watching earnings reports with particular interest in future guidance. Starbucks (SBUX) reported last night and provided guidance below expectations. This is a company that traditionally guides higher. The more skepticism in the market, the less likely that gains will stick. And that leads me to another chart to watch - the VIX. Check it out:
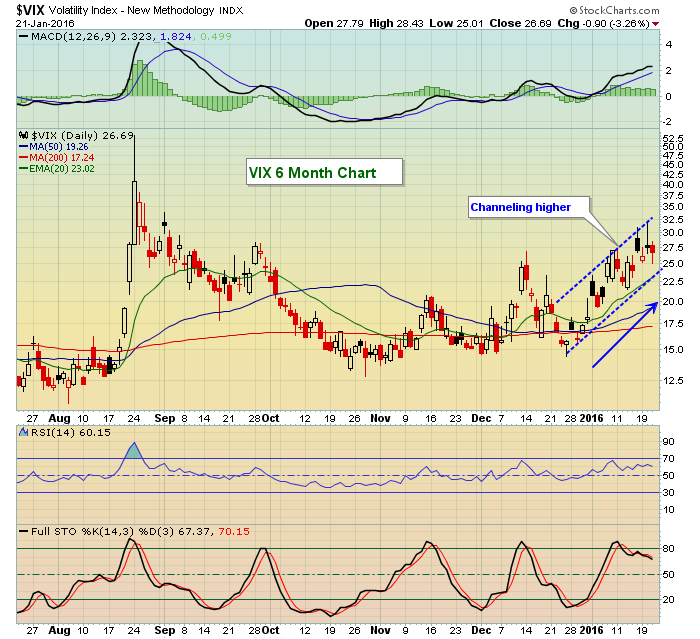 It will be interesting to see how the market reacts if the VIX falls to test the bottom of this up channel and its rising 20 day EMA, currently at 23.02. If channel support holds, the short-term rally will likely be over. If trendline support fails to hold, the psychological 20 level becomes key.
Sector/Industry Watch
Transportation stocks ($TRAN) has been a big disappointment in 2016 - and in the latter part of 2015 as well. They're very oversold, though, and the long tail from Wednesday appears to have marked a short-term bottom. I wouldn't be surprised to see at least a 20 day EMA test during this bounce. Here's the chart:
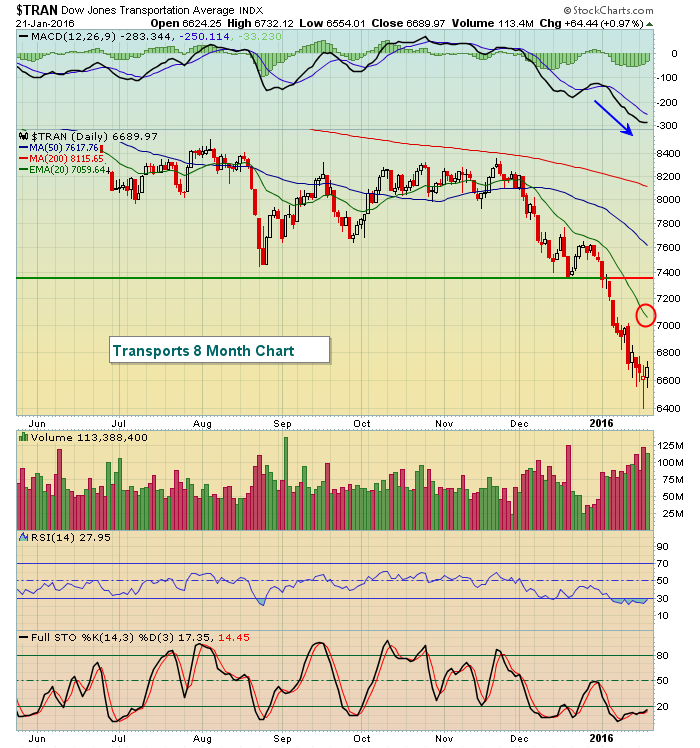 Don't get too greedy on the bounce. There's been huge volume on the recent selling, a sign of serious distribution. A bounce is not likely to last.
Historical Tendencies
Yesterday, I provided current week annualized returns for the S&P 500 since 1950. They weren't particularly bullish, although I did mention that history turns much more bullish historically as we move into next week. The same holds true for NASDAQ stocks since 1971. Here is today's annualized return, followed by each day next week:
January 22 (today): -64.12%
January 25 (Monday): +0.94%
January 26 (Tuesday): +25.32%
January 27 (Wednesday): +5.40%
January 28 (Thursday): +56.89%
January 29 (Friday): +15.31%
The first week of February tends to perform bullishly as well.
Key Earnings Reports
(actual vs. estimate):
COL: 1.21 vs .96
GE: .52 vs .50
SAP: 1.17 vs 1.23
STI: .91 vs .87
Key Economic Reports
January PMI manufacturing to be released at 9:45am EST: 51.0 (estimate)
December existing home sales to be released at 10:00am EST: 5,200,000 (estimate)
December leading indicators to be released at 10:00am EST: -0.1% (estimate)
Happy trading!
Tom


