Market Recap for Friday, January 29, 2016
On the surface, it was a super day. All nine sectors finished at least 1% higher with technology jumping more than 3% to lead the action. 21 of 23 industry groups within consumer discretionary (XLY) rose. And every industry group in the other eight sectors climbed. EVERY other industry group! I always want to see wide participation to confirm a rally and I think Friday's rally certainly qualified. So why is it likely to fail? Well, for more on that, check out the Current Outlook section below. First, let's discuss a couple positives.
Technology (XLK). Consumer electronics ($DJUSCE) soared on Sony Corp's (SNE) big earnings beat. "Rumor has it" that shareholders were "rolling in the dough (deep)" due to record-breaking sales from Adele's "25". It was SNE's best one day performance in several years. Software ($DJUSSW) also had a monster day as blue-chip Microsoft (MSFT) impressed Wall Street with its latest quarterly results. MSFT, like Facebook (FB) and Alphabet (GOOGL), have maintained very bullish longer-term charts and recent results help to explain why. These companies are primarily responsible for the outperformance of the XLK vs. the S&P 500 in 2015 and into early 2016. Since mid-2013, the XLK has been an area of major strength in U.S. equities. This chart says it all:
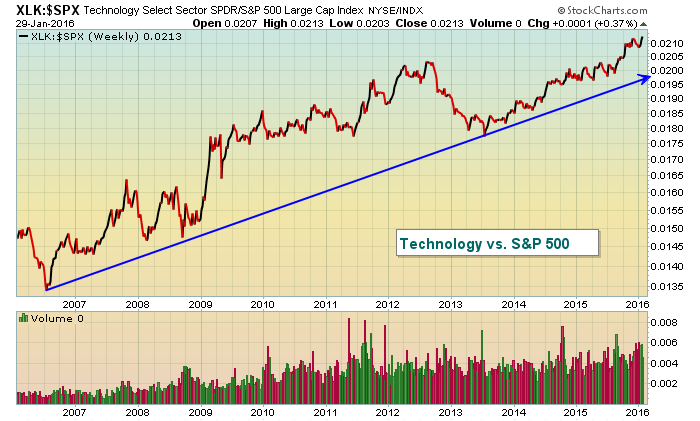 Outside of the 9-12 months of relative weakness in 2012 and 2013, technology has been the primary leader of this seven year bull market. If maintaining long positions currently, stocks like FB, MSFT and GOOGL would continue to be must owns. Risk tolerance would play a part in terms of position size and percentage of overall portfolio, but these stocks remain technically healthy and they're part of a sector that remains in charge.
Energy (XLE) was also a leader on Friday, gaining 2.9%. The XLE is up more than 15% since reaching its intraday low near 50.00 less than two weeks ago. The problem, however, is that both the XLE and crude oil prices ($WTIC are at or near key price resistance. Check it out:
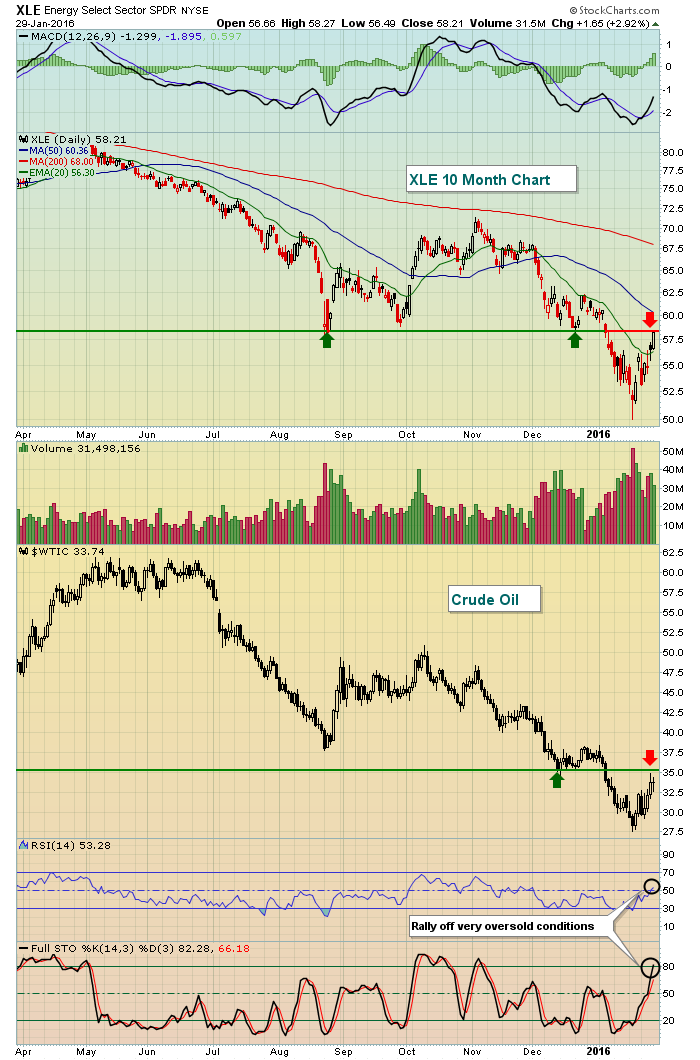 Over the past two weeks, the XLE has led the rally in U.S. equities, but it's been mostly an oversold bounce that, technically, should not be expected to last. Should the XLE begin to weaken again, what leads to extend the recent rally?
One final thought about Friday. It was the last day of January. The last trading day of ANY calendar month tends to be VERY bullish. The likelihood of an up day on the S&P 500 rises from 53% (for any day throughout the year) to more than 60% for the last trading day of the month. The reason? Market makers, portfolio managers, hedge funds, etc. buy prior to beginning of the month mutual fund in-flows.
Pre-Market Action
Overnight, the Nikkei index ($NIKK) rallied to clear its 20 day EMA similar to Friday's move on the S&P 500. The Hang Seng ($HSI) and Shanghai Composite ($SSEC), however, were both lower last night and they remain very technically challenged. Overall, the action in Asia is not particularly encouraging. If you're hoping to find more technical strength in Europe, I'm about to disappoint you. The London Financial Times ($FTSE) is failing after a 50 day SMA test. The French CAC 40 ($CAC) closed above its 20 day EMA on Friday, but is on the verge of moving back beneath that short-term moving average. Finally, the German DAX ($DAX) has not been able to clear its 20 day EMA and is down more than 1% today. The DAX is the one foreign index that most closely correlates to the S&P 500. Failure to clear the 20 day EMA on the DAX simply doesn't bode well for S&P 500 shares.
The action in the treasury market is also painting a dismal picture for equities. The move to negative interest rates in Japan surely has enabled the U.S. treasury market to attract global dollars to some degree, but if you look at how money has rotated to safety in nearly every area, this isn't just about U.S. treasury yields vs. foreign yields. It's also about the treasury market expecting economic weakness ahead. The Q4 GDP on Friday came in below expectations and the 10 year treasury yield ($TNX) followed that news by closing at its lowest level (1.93%) since April 2015. Investors are choosing bonds over equities and that's a very bearish development for equities.
Earnings reports will pour in this week. It will continue to be interesting to see guidance given the bet that bond traders are making that the U.S. economy is slowing.
Current Outlook
Ok, here's where we were and where we're at. Our major indices fell to test major price support just a couple weeks ago. After rallying on the S&P 500 for nearly two weeks, it's easy to forget where we were, but let me remind you. 1812. No, not the year 1812. That's where the S&P 500 stood at the low on Wednesday, January 20th. The rally through Friday has allowed the S&P 500 to recovery 128 points, or 7%. The RSI was oversold at the low with a reading below 30. The bounce has enabled that momentum oscillator to move back into neutral territory at 49. The RSI range from 50-60 generally provides resistance in a downtrending market and that's what I believe we're now in. I could be wrong, but you have to make a call and that's mine. Has this rally been impressive? Well, it depends how you look at it. A 7% move higher in 7 trading days should be viewed in a positive light.....unless like me you're interested in where the money has been going. First, let's just look at the overall S&P 500 chart, looking at price action only (no rotation):
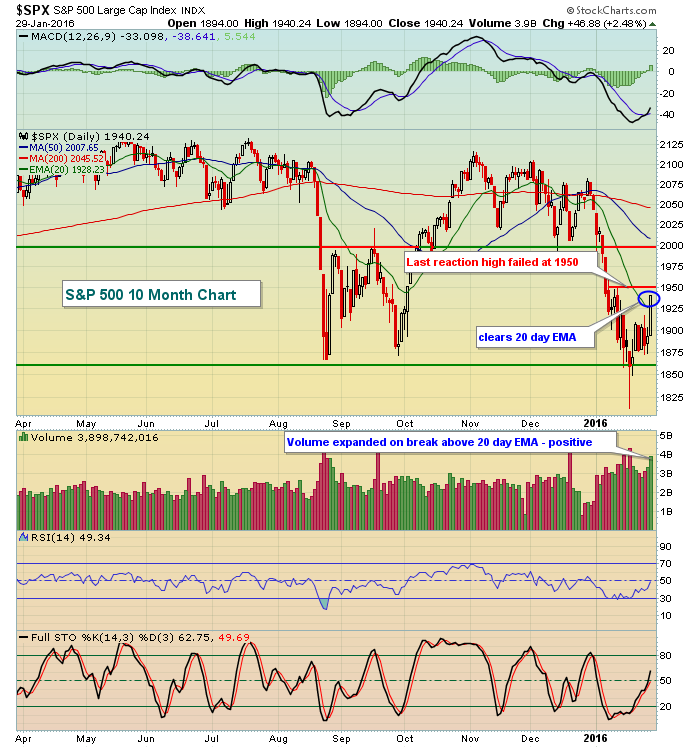 Not bad really. The strong push higher on Friday was accompanied by excellent volume. So it's difficult to argue against my favorite technical indication - the combination of price action and volume. But I look "under the surface" to determine the likelihood the technical price action will be sustained and that's where I'm having difficulty buying into this rally. In fact, for the first time in years, I'm looking to short into strength. Here's the visual of what's been taking place in terms of poor (bearish) rotation:
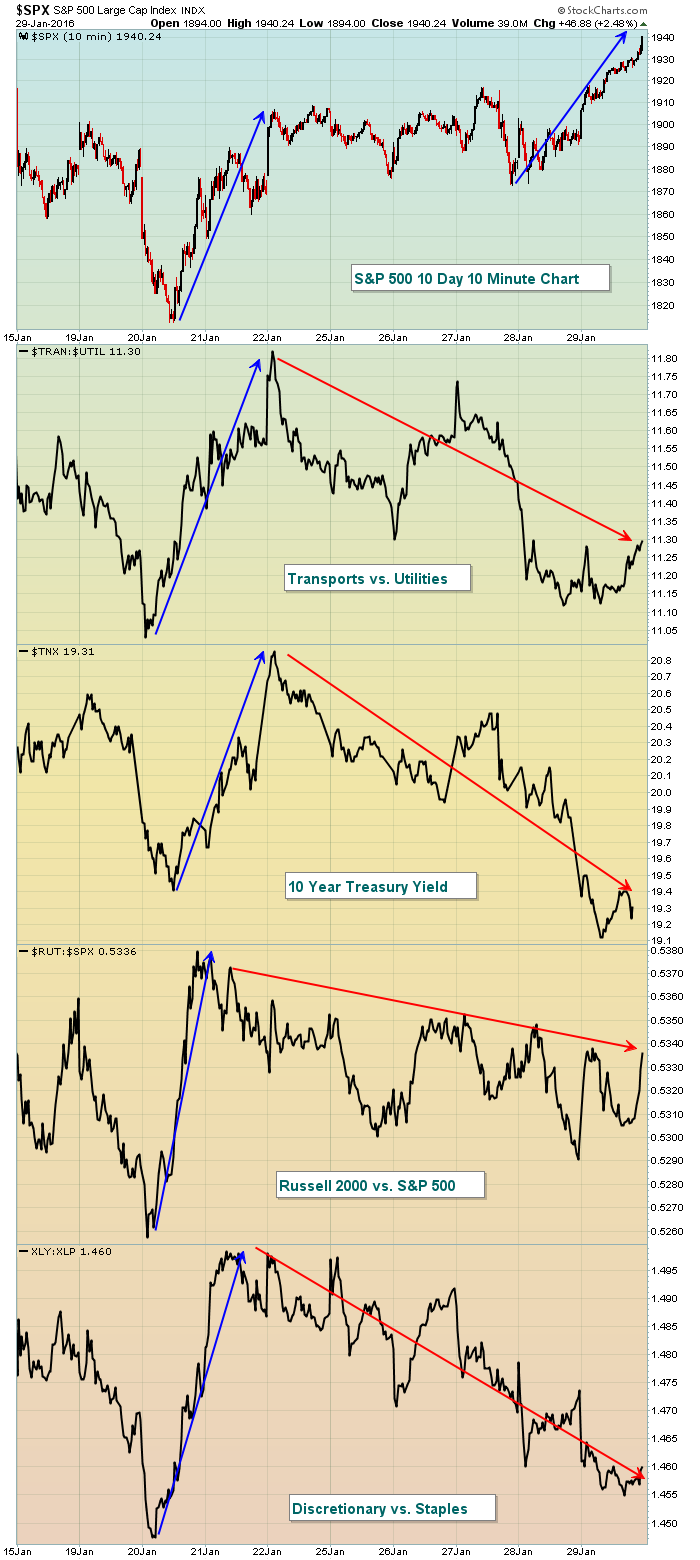 Check out the difference in rotation during the initial rally and what we've seen since. It's clear to me that market participants are turning much more cautious (bearish) as the rally unfolds. While that guarantees me NOTHING, I believe the risk is too great to support this rally. Instead, my inclination is to short the rally. There is room for further upside to 1995-2000 on the S&P 500 and that's the best reward to risk entry on the short side, should we get there. Building a short position on any rise to get there makes sense as well, but obviously there's more risk involved in shorting from the current level.
Given the lower futures today, I'll be watching to see if our major indices can continue to close above the 20 day EMA. The ability to do so would increase the likelihood of the S&P 500 reaching that major test closer to 2000. Failure, however, with the Volatility Index ($VIX) still above 20 could lead to a sudden resurgence of impulsive selling. Please be careful.
Sector/Industry Watch
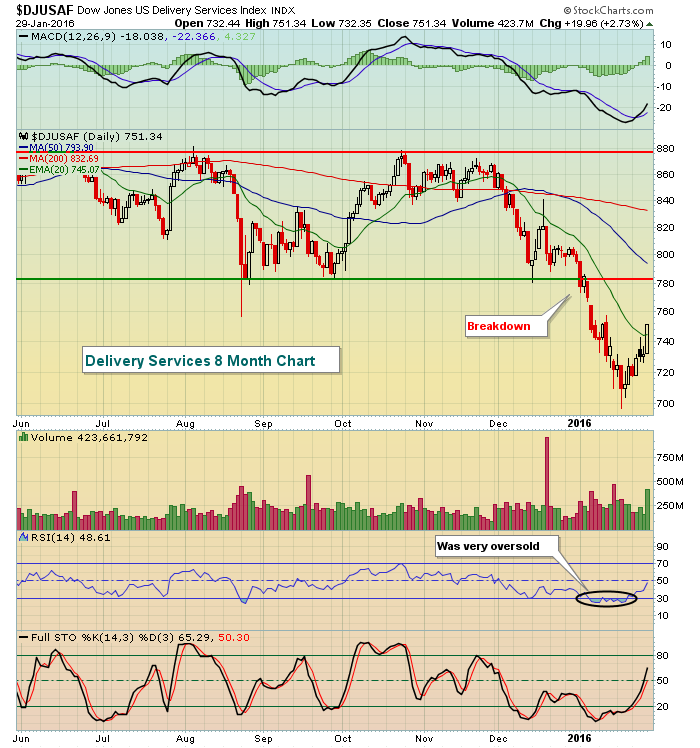
The industrial sector has been under significant relative pressure since December. The recent rally could be setting up failed bounces in areas within this sector. The Dow Jones U.S. Delivery Services index ($DJUSAF) is one such industry group. The breakout on Friday was impressive, but there's much more work to be done. Here's the current technical picture:
Historical Tendencies
The bulls do still have historical strength on their side as we enter February. Unfortunately, the "January Effect" is not painting a rosy picture for the balance of 2016. I'll provide more on that phenomenon in tomorrow's report.
Key Earnings Reports
(actual vs. estimate):
AET: 1.37 vs 1.20
CAH: 1.30 vs 1.25
RYAAY: .42 vs .30
SYY: .48 vs .41
(reports after close, estimate provided):
AFL: 1.48
APC: (1.05)
FIT: .20
GOOGL: 6.65
MAT: .60
PFG: 1.05
TSO: 2.07
Key Economic Reports
December personal income released at 8:30am EST: +0.3% (actual) vs. +0.3% (estimate)
December personal spending released at 8:30am EST: +0.0% (actual) vs. +0.1% (estimate)
January PMI manufacturing index to be released at 9:45am EST: 52.6 (estimate)
January ISM manufacturing index to be released at 10:00am EST: 48.3 (estimate)
December construction spending to be released at 10:00am EST: +0.6% (estimate)
Happy trading!
Tom


