Market Recap for Wednesday, January 20, 2016
The U.S. stock market finally had a day where traders decided enough was enough and they scurried into aggressive parts of the market. Even the 228 point gain on the Dow Jones Thursday, January 14th wasn't as impressive under the surface. Take a look at this 10 day 15 minute chart of the Dow with several intermarket relationships shown below:
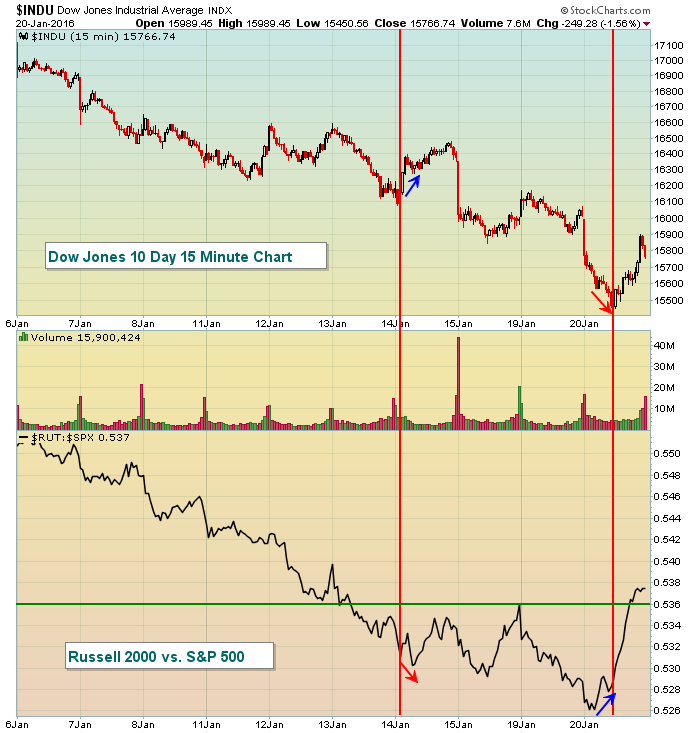 The relative performance of the Russell 2000 has been showing signs of strengthening the past few days but really excelled during Wednesday's afternoon session. The blue arrow at the bottom of the chart showed the relative performance on the RUT:SPX turn higher before equities bottomed. This was a welcome sign of at least temporary relief, but it will need to be sustained today. Other key relationships like $TRAN:$UTIL and XLY:XLP turned higher yesterday afternoon as well, but were not as bullish as the Russell 2000. Look for more relative strength there in the near-term.
Note that during the Dow's strength last Thursday, its initial move higher was not supported by improvement in the RUT:SPX and the strength didn't last. A sustained rally is not likely to occur unless dollars rotate toward risk. That will be key in the very near-term.
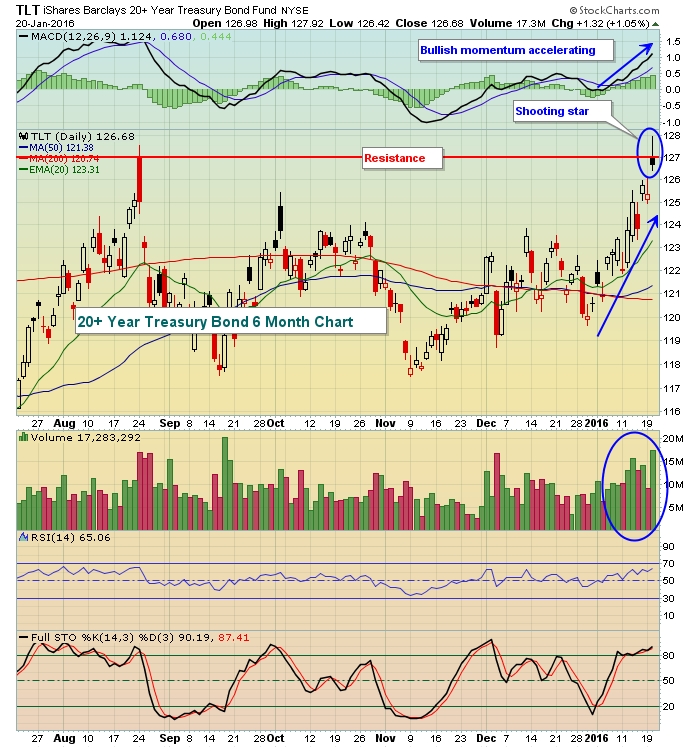
Treasuries (TLT) also reversed and a shooting star candle printed after its recent surge to the upside, potentially marking a short-term top at price resistance. If the TLT drops near-term, it'll likely occur with a rise in equity prices. Here's the bearish (bullish for equity prices) shooting star candle on the TLT:
 Sector leadership was much improved on Wednesday. While a defensive group - healthcare (XLV) - led the action, biotechnology ($DJUSBT) was the primary reason why. This industry group gained 2.2%, far outpacing the general market.
Pre-Market Action
Futures have turned positive after trading in negative territory overnight and most of this morning. Economic reports and earnings reports were mixed. Jobless claims spiked unexpectedly to 293,000 while estimates called for a drop from 284,000 to 275,000.
But the big news this morning has been comments from European Central Bank President Mario Draghi. He reiterated an earlier stance that the ECB has "power, willingness and determination" to act and further stated "we have plenty of instruments, as you know". Central bankers are the shorts' worst enemies for sure and the reaction in global markets underscores this. U.S. futures have turned from solidly red to bright green in the past hour and equities now look to extend the gains realized Wednesday afternoon.
Current Outlook
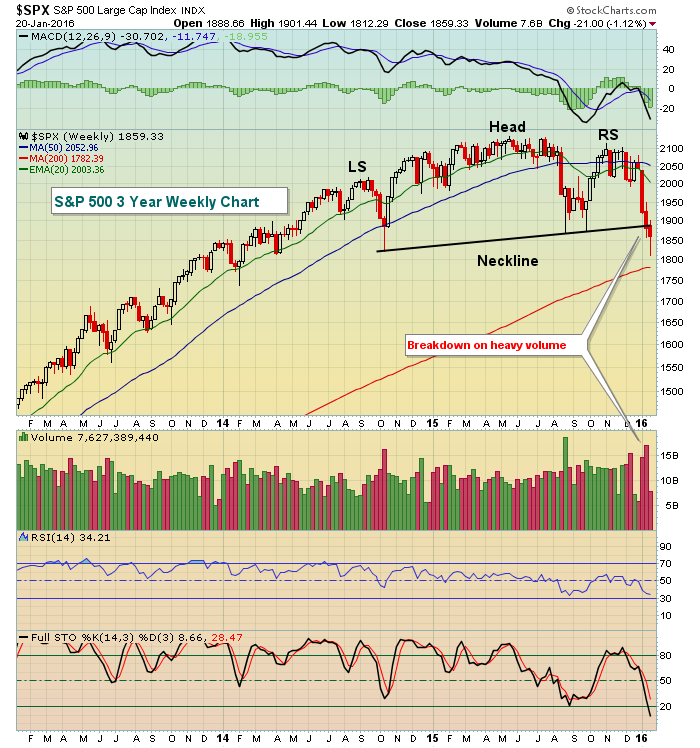
First, let me be clear that a tremendous amount of technical and intermarket damage has been inflicted and I look for any short-term strength to be just that - short-term. I give the market a decent chance of rebounding from here for a number of reasons. First, yesterday's afternoon reversal occurred on extremely heavy volume. The NASDAQ, for instance, traded more than 3 billion shares for only the third time in the past year. The last time coincided with quad witching expiration day in December. The only other time volume was this high was the day the stock market bottomed in August. A necessary ingredient for capitulation is massive volume and we saw that yesterday with significant reversals in many areas of the market. The S&P 500 actually traded below the October 2014 low on an intraday basis before rallying. We either just broke neckline support in a bearish, topping head & shoulders pattern or we just established the right side of the neckline. Take a look:
 This is one possibility, but let me offer up another possibility if we bounce from here:
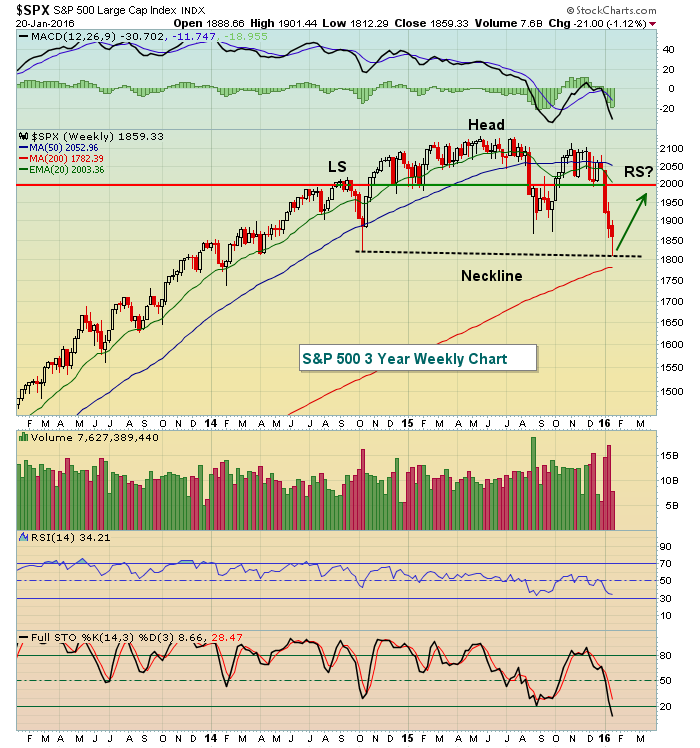 Neither of these charts are bullish. The extent of a short-term bounce and the timing of the next leg lower would be slightly different, that's all. Of course there are also possibilities 3 and 4. Scenario 3 would continue the recent selling and futures have been lower overnight. Nothing guarantees us a bounce, I just believe the conditions are ripening for one. Scenario 4 is a resumption of the bull market since we reversed at key price support. I'd love to believe this one to be true, but there'd need to be a LOT of positive developments beneath the surface during the next bounce to consider this one.
Sector/Industry Watch
Should the market bounce and money continue to flow into more aggressive areas, broadline retailers ($DJUSRB) look interesting on their weekly chart. Check this out:
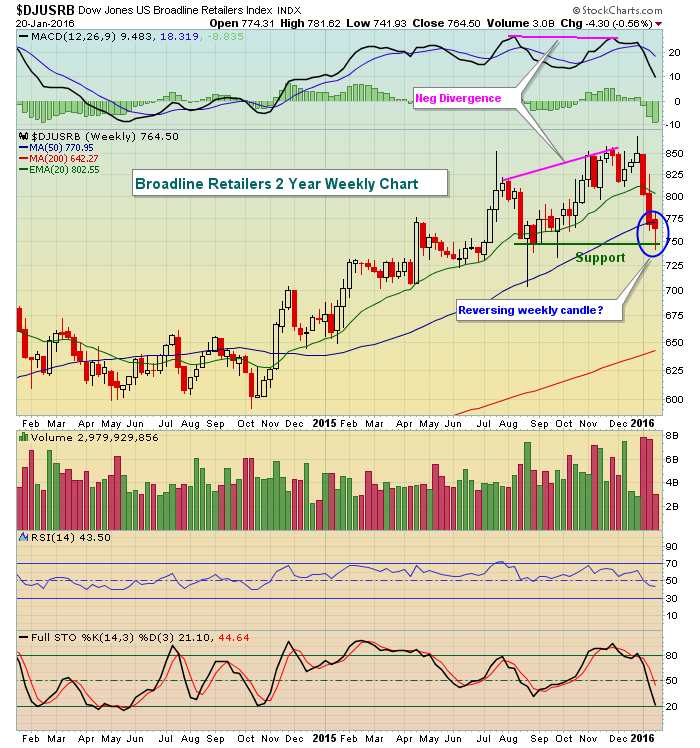 There was a slight negative divergence in late 2015, helping to explain the recent drop to test the rising 50 week SMA. This group has been very strong technically and on a relative basis, thanks in part to the strong performance of Amazon.com (AMZN) in 2015. It would seem that a pre-earnings runup in AMZN shares could lead a potential rally. (Disclosure: I bought AMZN yesterday for a short-term trade only). AMZN reports its results next Thursday, January 28th.
Historical Tendencies
If we do see a short-term rally, it will go against the historical tendencies of the S&P 500. Since 1950, here are the annualized returns for this week:
January 19 (Tuesday): -11.01%
January 20 (yesterday): -82.39%
January 21 (today): +8.47%
January 22 (tomorrow): -19.10%
The good news is that next week begins a bullish historical period where the S&P 500 has produced positive annualized returns for each day from the period January 25th (Monday) through February 3rd.
Key Earnings Reports
(actual vs. estimate):
BBT: .68 vs .69
BK: .68 vs .64
JBHT: 1.01 vs 1.00
LUV: .90 vs .90
TRV: 2.90 vs 2.71
UAL: 2.54 vs 2.59
VZ: .89 vs 88
(reports after close, estimate provided):
AXP: 1.13
ISRG: 4.11
SBUX: .45
SLB: .63
Key Economic Reports
Initial jobless claims released at 8:30am EST: 293,000 (actual) vs. 275,000 (estimate)
January Philadelphia Fed Survey released at 8:30am EST: -3.5 (actual) vs. .4.0 (estimate)
Happy trading!
Tom


