Market Recap for Thursday, February 25, 2016
Financials (XLF) rallied nicely on Thursday to lead this extended market rally. Unfortunately, four of the six best performing industry groups within financials were REITs, the more defensive area of financials. Industrials (XLI) also performed well with aerospace ($DJUSAS) the leader there. The DJUSAS tested its 50 day SMA on Thursday, along with price resistance. Check this out:
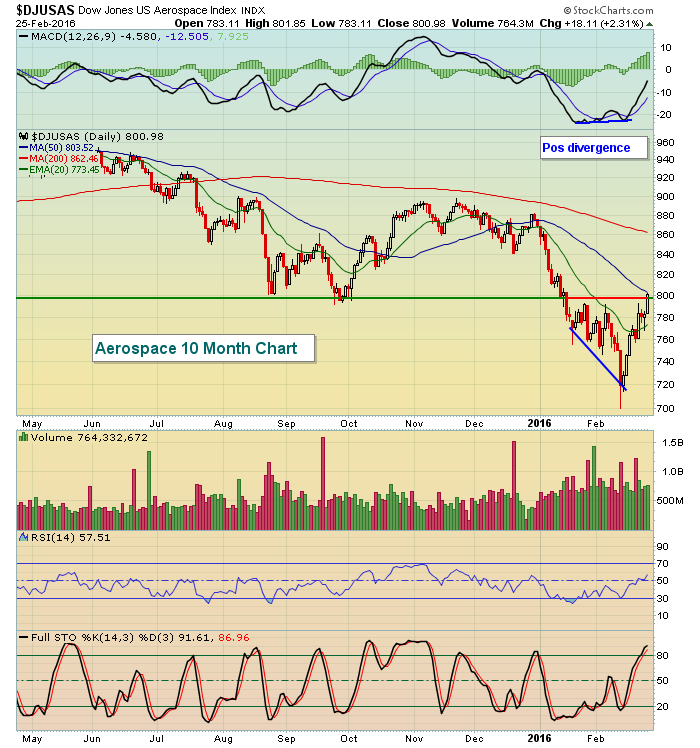 The positive divergence has now played out with the 50 day SMA test, along with the MACD centerline reset. Volume trends in this group are fairly strong, however, so I'd give this group a decent chance of continuing this run to perhaps 825-840. We'll see.
Pre-Market Action
Several solid earnings reports this morning and a better-than-expected GDP 2nd estimate (+1.0% vs. +0.4%) has buoyed U.S. equities as it looks as if the recent rally will be extended - at least into today's open. After clearing the 50 day SMA on both the Dow Jones and S&P 500, the more aggressive NASDAQ and Russell 2000 will look to do the same today or early next week.
Overnight, the Hang Seng index ($HSI) rallied strongly while both China and Japan showed gains as well. That strength has carried over into Europe where we see the major indices there climbing this morning as well. So globally, the coast is clear for another rally today. At this point, I'd look for an S&P 500 test just shy of 2000. From there, we'll see what this rally is truly made of.
Current Outlook
In order to fully embrace this rally, there are two areas of vital importance. The first - and most important - is that the combination of price/volume support and confirm the action. Thus far, it's been unimpressive. There are many who would look at yesterday's rally on very light volume and completely write it off. I think that's a mistake. Yes, we did clear the 50 day SMA so it would be much more bullish if volume had soared. But the more important level for me is what I consider to be significant price resistance at 1995 on the S&P 500. If we can clear that level with a substantial increase in volume, I'll be more impressed and consider more bullish implications. Until then, I'm a fan of using this strength to build short positions - if you choose to trade on that side of the fence. Here's a refresher on the S&P 500's key resistance zone:
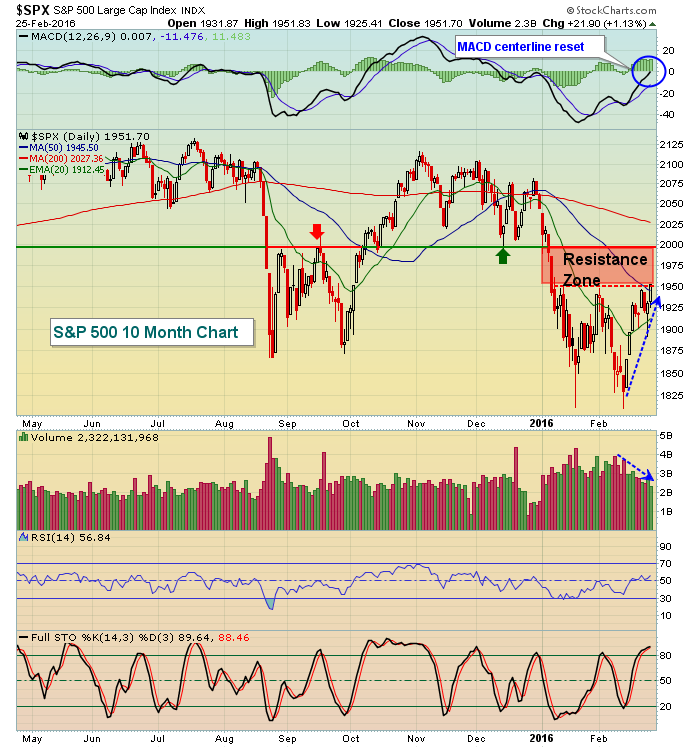 Here are a few thoughts about the current state of the market. First, the positive divergence on the MACD suggested a trip to the 50 day SMA and a MACD reset at its centerline. Check. Second, this rally has been supported by fewer and fewer buyers as the uptrend has unfolded (blue dotted arrows shows price move higher while daily volume bars drop). This doesn't guarantee failure, it just provides the bears a window of opportunity. Third, stochastic of 90 coupled with an RSI reading of 57 is overbought if, in fact, we're in a bear market. RSIs don't typically move through 60 as prices downtrend. The close on Thursday above 1950 cleared both short-term price resistance and the 50 day SMA. These are not insignificant and could certainly point to a test of 1995 price resistance. The red shaded area marks an important resistance zone where I'd look for a possible reversal. The VIX moved back into the teens again on Thursday. Again, that's approaching a level where we typically see the VIX bottom in a bear market rally. I'm featuring the VIX in the Sector/Industry Watch section below.
The second major area of importance to focus on is sector and asset class rotation. Market participants turned extremely cautious over the past few months, prepping for what is likely bear market action ahead. While they don't have to be correct, if the market has truly turned a corner and improving economic conditions lie ahead, we should see a reversal of the rotation we've recently experienced. A break above the resistance zone identified above should be accompanied by money rotating towards safety. While we've seen a bit of that during this rally, the breakout yesterday of the S&P 500 was not really accompanied by market participants growing more aggressive. Here's a repeat of a recent chart I highlighted. Take a look at the update:
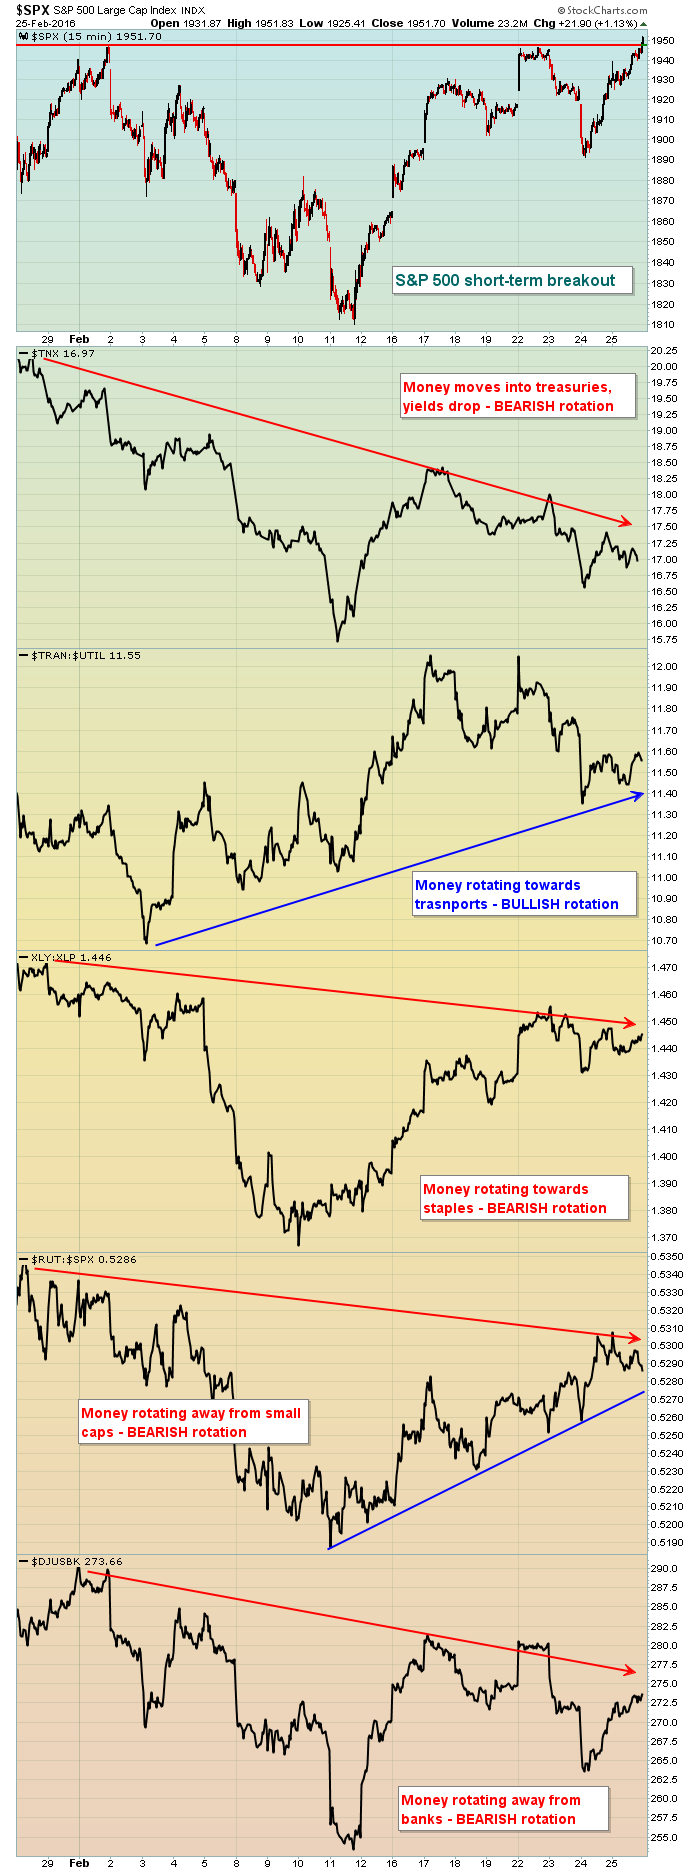 This represents the market action over the past 15 days. As the S&P 500 sold off and then rallied, I've highlighted various relative ratios and the direction of both the 10 year treasury yield ($TNX) and the Dow Jones U.S. Banks Index ($DJUSBK). The only chart above that seems to support the sustainability of this rally in the benchmark S&P 500 is the TRAN:UTIL - and that ratio was so beaten down previously that this could be nothing more than an oversold bounce in the ratio. In other words, I can't jump on the bulls bandwagon at this point. I need more confirmation that money supports the notion of economic improvement ahead.
A further spike in the S&P 500, especially above 1995, needs to be supported by increasing volume, not decreasing....and rotation to aggressive areas of the market. It can happen, but I need to see it first. In the meantime, my strategy will be to short this strength.
Sector/Industry Watch
The Volatility Index ($VIX) once again moved beneath 20 on Thursday's close. In prior bear markets, you can see that the VIX normally bounced (and the S&P 500 fell) when the VIX approached 17. Check out the charts of the two prior bear markets:
2007-2009:
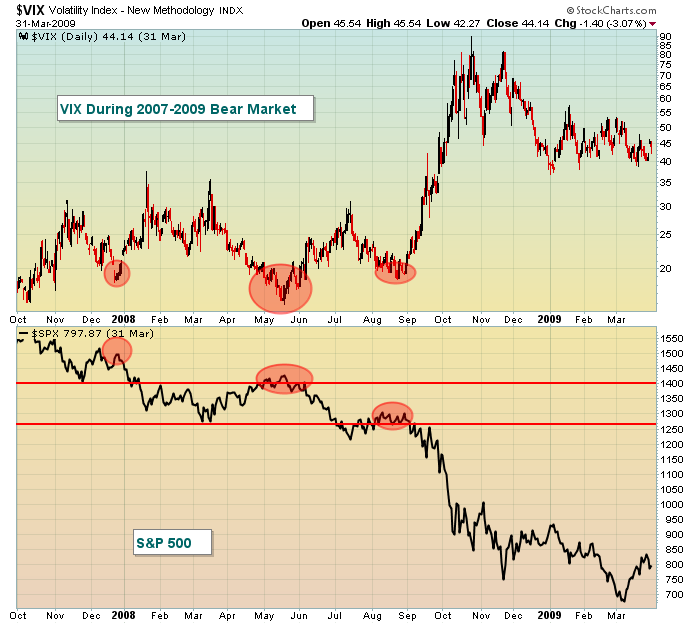 Interestingly, the last two times the VIX fell below 20 during this bear market, prices on the S&P 500 rose to barely clear price resistance before tumbling back down. In today's environment, that key resistance level is 1995 so a move slightly above that level on lighter than normal volume and a lack of rotation towards aggression would still be viewed bearishly by me.
2000-2002:
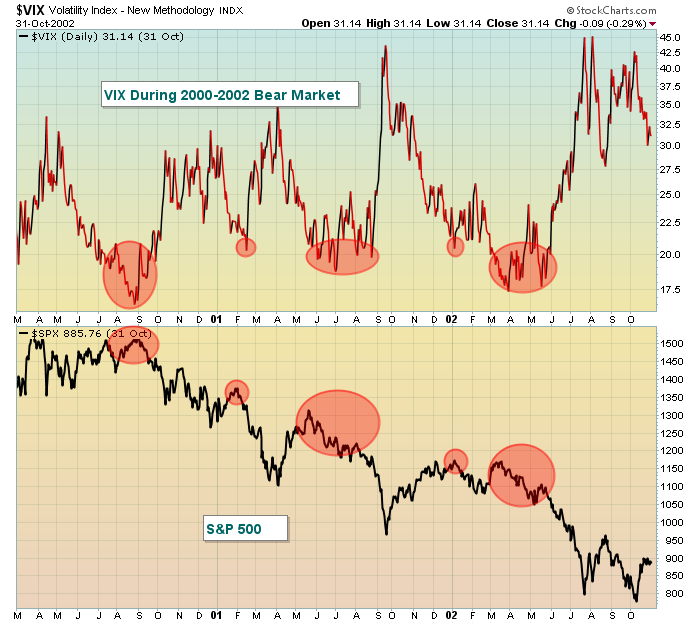 Understand that bear markets are characterized by fear and high VIX readings. The 2016 rally would begin to look more believable and sustainable if the VIX fails to bounce from this 17-20 area.
Historical Tendencies
Yesterday, I featured early March annualized returns on the S&P 500 since 1950. Today, let's look at those same annualized returns for the Russell 2000 (since 1988):
March 1: +115.46%
March 2: -67.30%
March 3: +34.03%
March 4: +146.61%
March 5: -27.41%
While there are a couple days with negative annualized returns, the overall trend in early March is quite favorable for small cap stocks.
Key Earnings Reports
(actual vs. estimate):
AMT: 1.27 vs 1.24
BID: 1.19 vs 1.13
FL: 1.16 vs 1.12
JCP: .39 vs .22
MGA: 1.19 vs 1.13
Key Economic Reports
Q4 GDP - 2nd Estimate - released at 8:30am EST: +1.0% (actual) vs. +0.4% (estimate)
January personal income to be released at 10:00am EST: +0.4% (estimate)
January personal spending to be released at 10:00am EST: +0.3% (estimate)
February consumer sentiment to be released at 10:00am EST: 91.0 (estimate)
Happy trading!
Tom


