Market Recap for Friday, February 26, 2016
Materials (XLB) led bifurcated action on Friday as this sector rose 1.45%, more than double any other sector. Both the NASDAQ and Russell 2000 showed gains, while the Dow Jones and S&P 500 finished in negative territory. The XLB drew strength from specialty chemicals ($DJUSCX), which gained 1.80% Friday. Positive divergences on both the daily and weekly charts are helping the DJUSCX. Check out both charts below:
First the daily.....
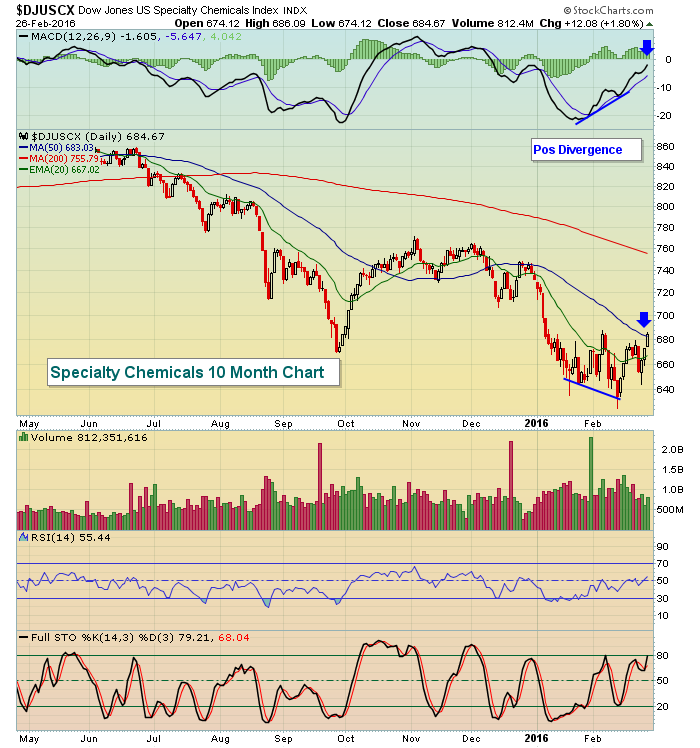 The blue arrows highlight the MACD centerline "reset" and the 50 day SMA test that I look for after a positive divergence prints. The daily chart doesn't really provide many clues as to which direction the next trend will emerge. But on the weekly chart.....
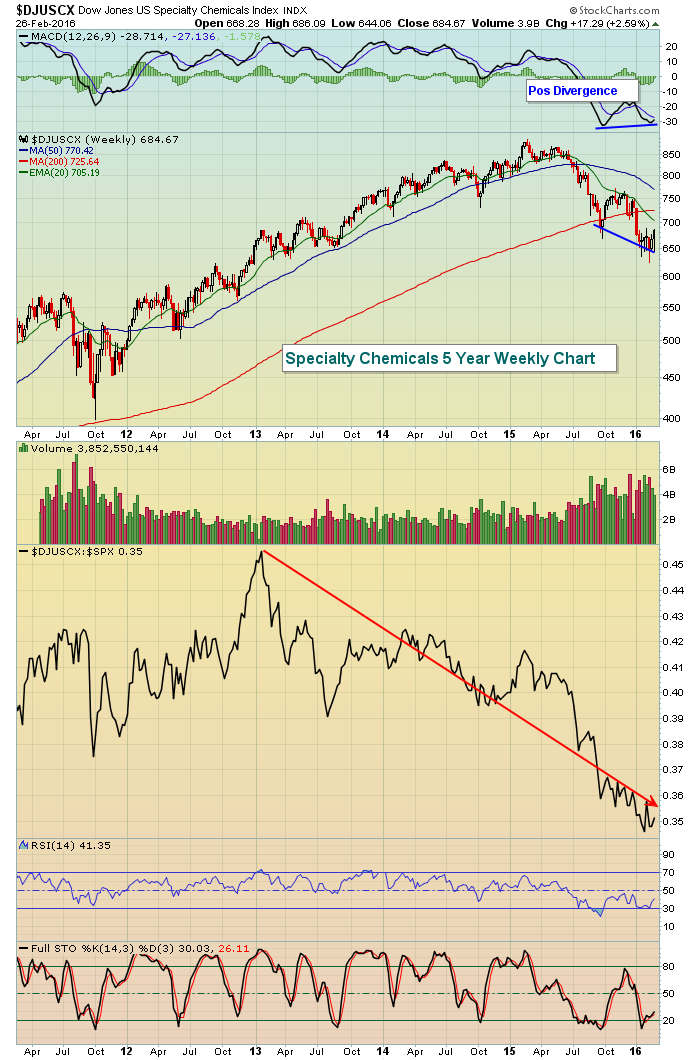 There's a slight positive divergence on the weekly chart and that suggests that the recent strength could continue. The rapidly-declining 20 week EMA is now at 705 so perhaps we'll see that level. One problem with this group is that its underperformance relative to the S&P 500 is accelerating so it's no slam dunk that we see further appreciation here, especially if the S&P 500 rolls over again.
The two weakest sectors on Friday were consumer staples (-1.41%) and utilities (-2.76%) as these two defensive groups were shunned. Utilities (XLU) printed a negative divergence on its most recent high and the failed breakout suggests the XLU is heading lower to test its rising 50 day SMA. As for consumer staples (XLP), there was a reversing candle that printed on Friday. See the Sector/Industry Watch section below for more details on the XLP.
Pre-Market Action
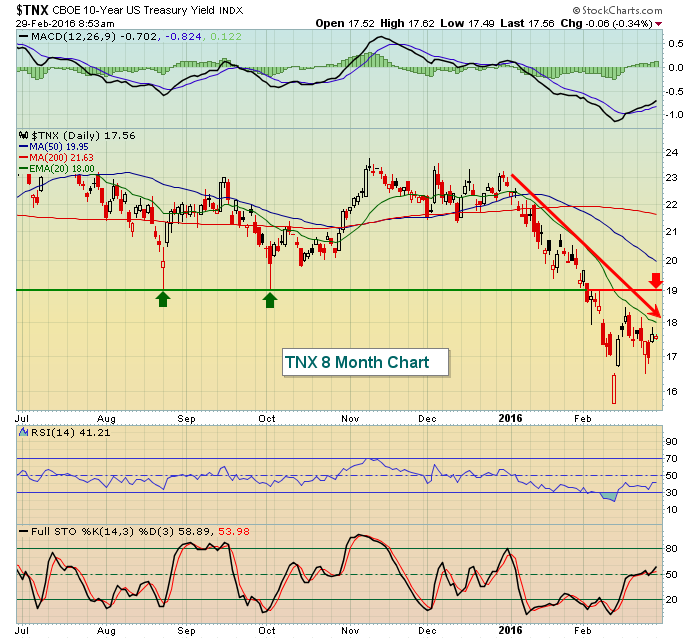
Let's talk treasuries for a moment, specifically the direction of the 10 year treasury yield ($TNX) in 2016 thus far. One problem that I have with the current S&P 500 rally is the fact that it's not being confirmed by the selling of treasuries (which would send the TNX higher). While we've seen the S&P 500 clear its 50 day SMA, the TNX has yet to clear even its 20 day EMA one time in 2016. Take a look at the downward spiral in yields:
 Think about why the TNX would fall. First and foremost, it falls because treasuries are being bought. Remember, investors and traders have a decision to make every day - either buy treasuries or equities, or some combination of both. Second, it's normally uncertainty over economic improvement that drives money into treasuries. If you believe economic conditions will deteriorate, you want to bypass most equities as decreasing bottom line results will likely drive equity prices lower. Hence, treasuries become the safer alternative.
In the above chart, money continues to rotate towards the defensive treasuries. It's difficult to get excited about an equity rally when the bond market is suggesting caution.
Futures this morning have just turned positive after being in negative territory overnight. The bulls will look to extend recent gains. Loss of 50 day SMAs to the downside on increasing volume would be a bearish development while the 1995 level on the S&P 500 will be one key price resistance level that I'll be watching for on any further upside move.
Current Outlook
I've shown in the past the positive correlation between technical price action in Germany ($DAX) vs. the S&P 500 and the inconsistency of positive correlation between China ($SSEC) and the S&P 500. Japan ($NIKK) falls somewhere in between where there does tend to be mostly positive correlation over the long-term. Here's a 15 year chart of the NIKK with the correlation between the NIKK vs. the S&P 500 shown beneath it:
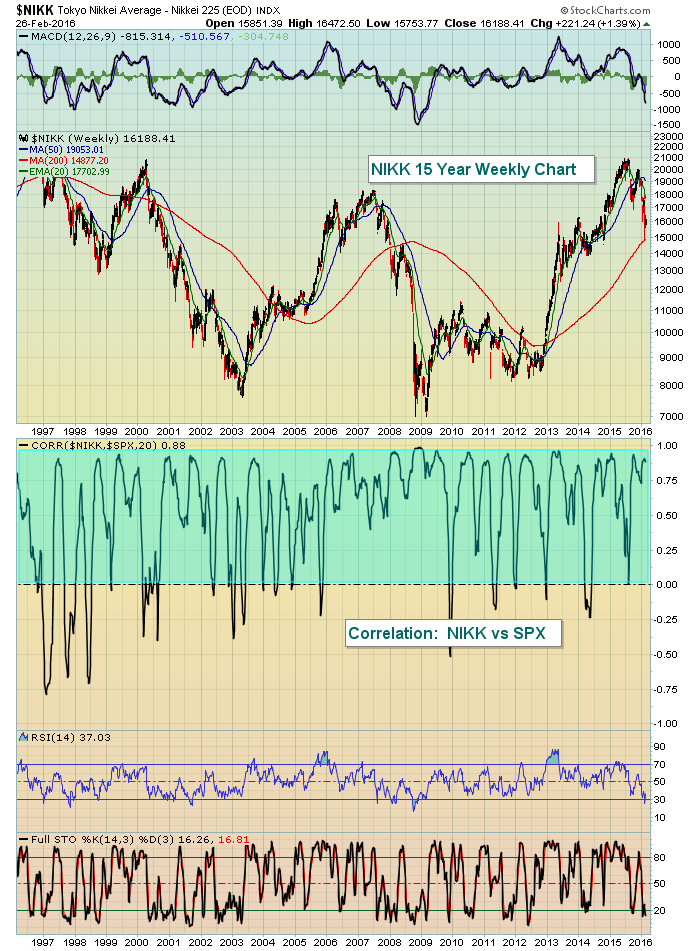
I'll shorten the duration of the NIKK chart in just a minute, but the purpose of the above chart is to simply show the positive long-term correlation between the NIKK and SPX. The blue shaded area shows the relationship in positive territory most of the last 15 years, meaning that the NIKK and SPX tend to move in the same direction. Why is that important? Well, take a look at the NIKK weekly chart below:
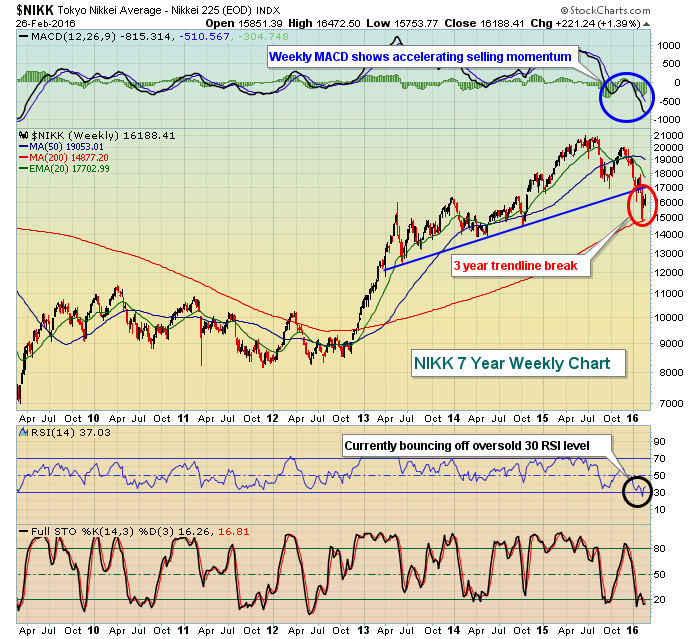 The NIKK has climbed over the past couple weeks, but it appears to be nothing more than an oversold bounce. Failure to sustain the current rally would likely put pressure on the S&P 500's attempt at a continuing recovery. Keep an eye on Japan for further directional clues here in the U.S.
Sector/Industry Watch
Consumer staples (XLP) printed a bearish engulfing candle on Friday, one day after it broke out to fresh all-time highs on Thursday. Check out both the candlestick and the volume disparity between Thursday and Friday:
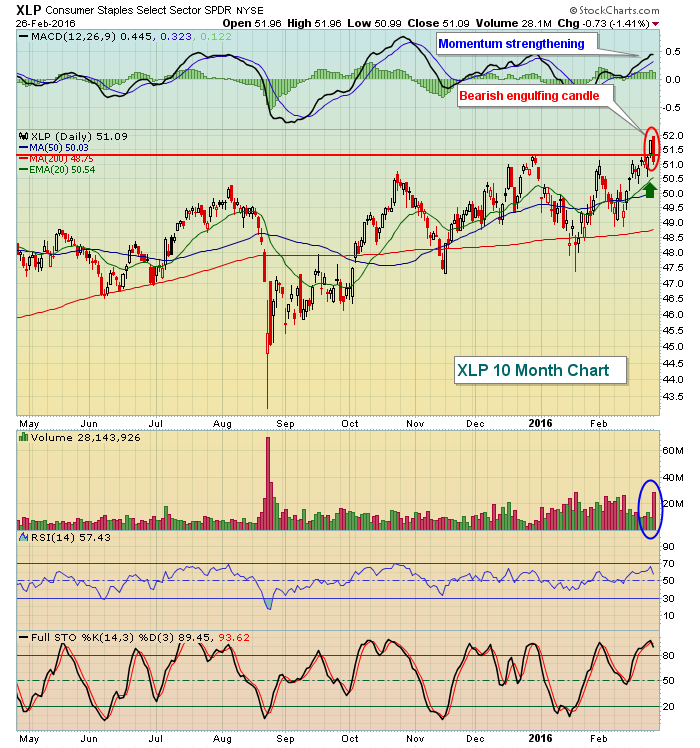 While the reversing candle is short-term bearish, the daily MACD shows strengthening bullish momentum so I'd expect this weakness to be temporary - perhaps down to test the rising 20 day EMA (green arrow). Volume was exceptionally high on Friday, indicative of distribution and further confirming the likelihood of short-term weakness. Of course, if you're bearish this sector, Friday's high becomes an important resistance level. Keep stops in place should that level be cleared.
Historical Tendencies
Mondays have historically been the weakest calendar day of the week. Results have varied by decade, but with the exception of the 1990s, Mondays have produced awful numbers. Below is the annualized return for Mondays for each of the following decades:
1950s: -32.54%
1960s: -40.28%
1970s: -30.52%
1980s: -27.24%
1990s: +30.10%
2000s: -4.50%
2010s: +3.34% (through December 31, 2014, hasn't been updated for 2015 and early 2016)
The 1990s were clearly bullish for Mondays, but that decade was strong for every calendar day of the week. Every other decade has reflected anything from average performance to downright horrid performance. Be particularly careful of Mondays that fall between the 18th and 27th calendar days of the month. That's the time of the calendar month when the stock market tends to perform poorly. The historical return of Mondays simply adds to the weakness.
Key Earnings Reports
(reports after close, estimate provided):
WDAY: (.40)
Key Economic Reports
February Chicago PMI to be released at 9:45am EST: 52.9 (estimate)
January pending home sales to be released at 10:00am EST: +0.5% (estimate)
Happy trading!
Tom


