Market Recap for February 24, 2016
After very early strength in the U.S. dollar index ($USD) on Wednesday to challenge the 98 level, the greenback fell sharply, allowing for a very quick recovery in energy (XLE) and materials (XLB) stocks and that propelled our major indices into positive territory in afternoon action. It was impressive for sure as each of our key major indices had fallen back beneath their respective 20 day EMAs and were faced with the potential of further technical selling. Here's a chart showing the surge, then quick selloff in the dollar (UUP) and its impact on the XLE, XLB and SPX:
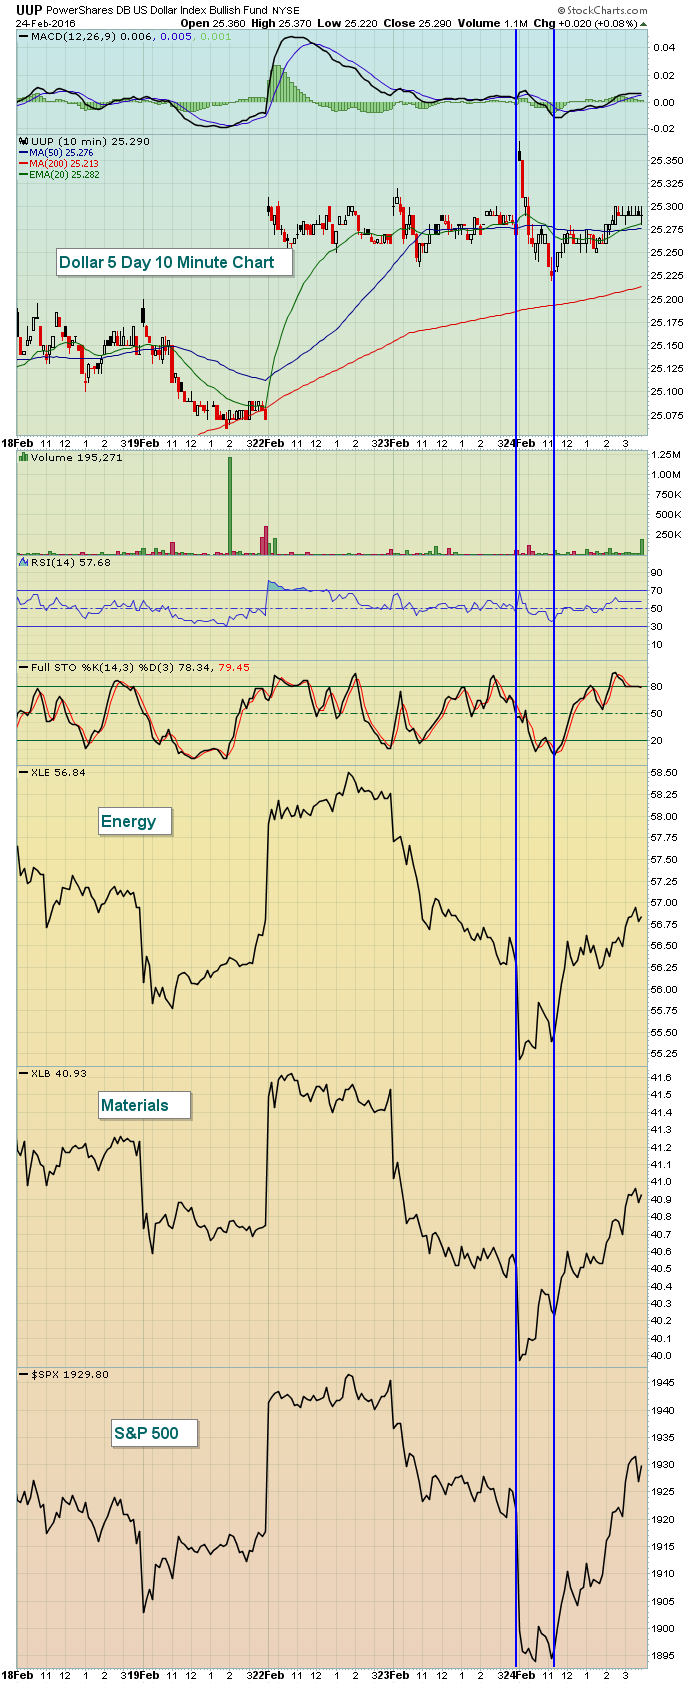 The two blue vertical lines highlight the surge in the dollar at the open, followed by its rapid retreat. The negative correlation with energy, materials and the benchmark S&P 500 is obvious.
Materials were able to hold onto key 20 day EMA support, but still face trendline resistance, as reflected on the chart below:
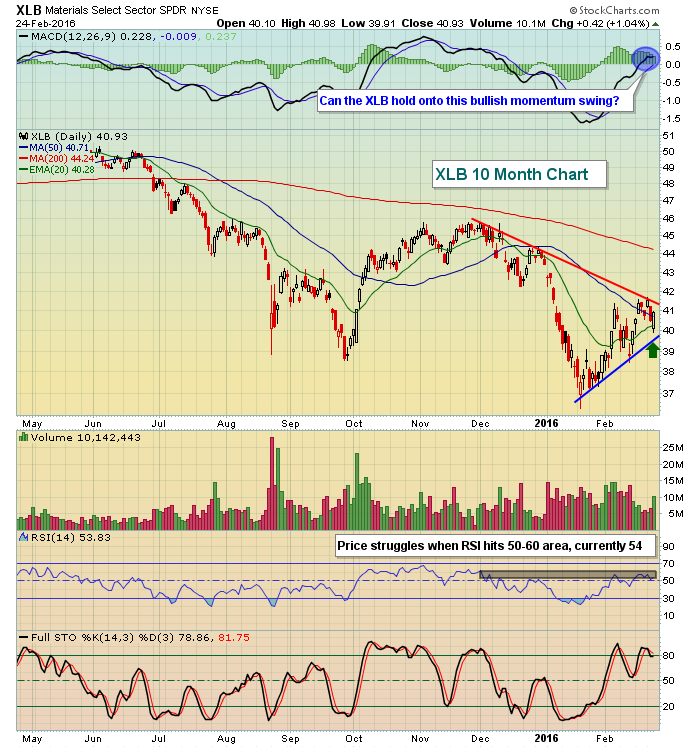 The short-term uptrend has been nice, but price is squeezing between that uptrend line and the intermediate-term downtrend line. Generally, the bigger picture trends win. We'll find out soon enough in this case.
The underperformance of banks ($DJUSBK), asset managers ($DJUSAG), consumer finance ($DJUSSF) and the like dragged down the financial stocks. In the Sector/Industry Watch section below, I look at the consumer finance space where mixed signals abound.
Pre-Market Action
The big news overnight was the 6.41% drop in China's Shanghai Composite ($SSEC) to 2741.25. It was steadily marching toward a significant price test near 3000 but never quite made it. Tokyo's Nikkei ($NIKK) rose nicely although it remains pressured technically. Hong Kong's Hang Seng ($HSI) followed the lead of China, though it's drop of 1.58% was much more palatable.
In Europe, the major indices are higher to the tune of 1.70% to 2.30%. Yesterday, the German DAX ($DAX) failed in a big way to hold 20 day EMA support as the DAX fell 2.64%. Today's gain is nice, but the DAX has yet to re-establish its price back above that key 20 day EMA. Failure to do so might suggest the current kick save and rally on the S&P 500 won't last. I'd keep a close eye on the DAX as the S&P 500 many times takes its cue from this index.
Today shows a large number of companies reporting earnings and they're quite mixed. In addition, jobless claims and more housing news is/will be reported. So traders have plenty to review as they decide whether to continue to support this current leg higher in equity prices. We're between 20 day EMA support and 50 day SMA resistance. Our first clue as to near-term market direction will likely be which of these two key moving averages is lost first.
Current Outlook
Let's take a look at small cap stocks. First, from an intermediate-term perspective, the recent lows mark support and a potential 50 day SMA test to reset the daily MACD marks key resistance. If the rapidly declining 50 day SMA can be negotiated, the Russell 2000 could reach price resistance near 1080. I would expect a battle there, if the RUT can make it to that level. Here's a visual of the current technical outlook:
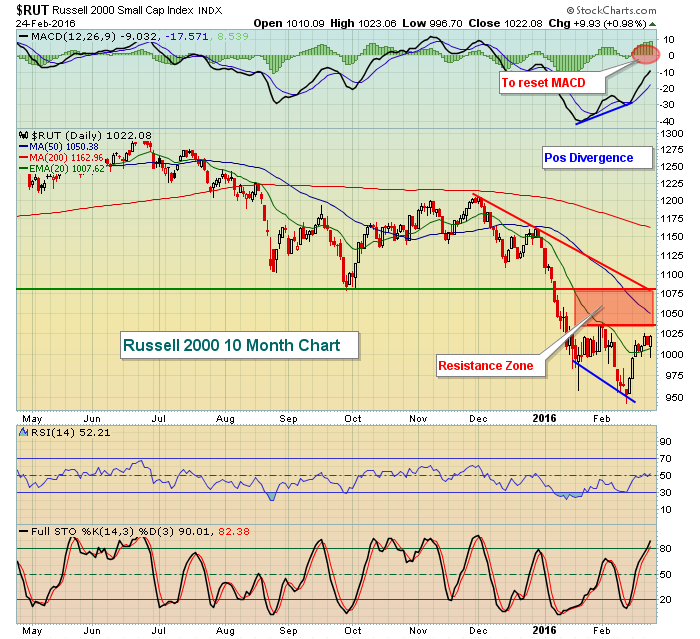 That's a fairly wide range of resistance, but keep in mind we're in a market where the VIX has been regularly trading in the 20s up to 30. It's difficult to ignore the potential of volatility in the days ahead given these readings. And the Russell 2000 tends to be more volatile than our other major indices.
Sector/Industry Watch
Consumer finance ($DJUSSF) really struggled in January like the overall financial sector, but did print a positive divergence on its early February price low. That has allowed the index to push back through its 20 day EMA, but reaching its 50 day SMA to reset its MACD at its centerline hasn't been easy. The first step will be to clear initial price resistance close to 165.50 on a closing basis. Then the 50 day SMA (currently 169.20) and major price resistance closer to 171.00 would be next. Here's a look:
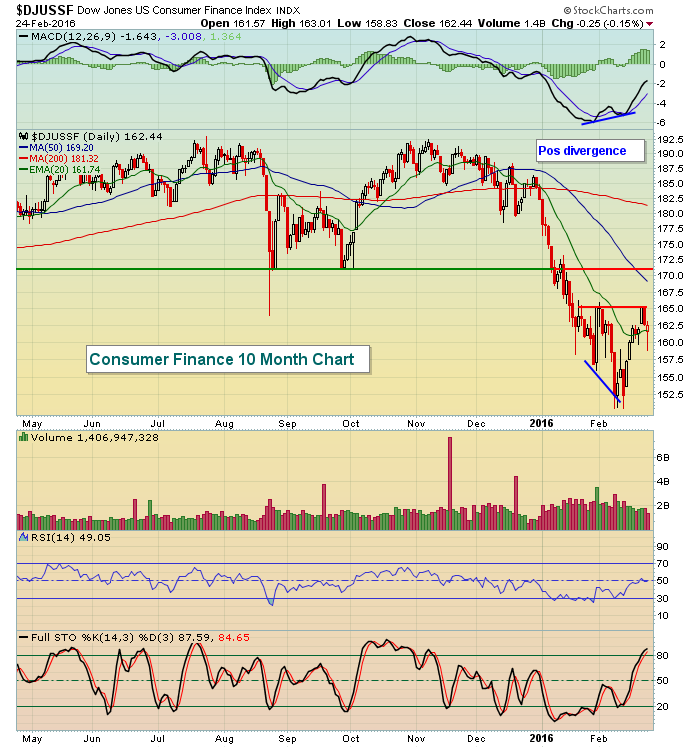 Volume has been declining on this rally, but the index did make a key reversal on Wednesday to close above its 20 day EMA for the sixth consecutive session. Be careful if this moving average is lost on a close, especially if volume accelerates.
Historical Tendencies
I've noted many times in the past that the 28th of the calendar month through the 6th of the following calendar month have produced all of the gains on the S&P 500 since 1950. It's an amazing stat - to think that one third of the calendar month is responsible for all of the gains on our benchmark index. February is a bit strange in this regard, however, as the S&P 500 has enjoyed very little historical strength in late February. Instead, early March tends to provide the bulls their best historical chance at a rally. Here are the annualized returns for the first five days of March since 1950 on the S&P 500:
March 1: +68.37%
March 2: + 8.71%
March 3: +27.41%
March 4: +46.98%
March 5: +29.00%
Key Earnings Reports
(actual vs. estimate):
APA: (.06) vs (.54)
BBY: 1.53 vs 1.40
CHS: .05 vs .00
CPB: .87 vs .87
KSS: 1.58 vs 1.55
TD: 1.17 (C) vs 1.19 (C)
(reports after close, estimate provided):
ADSK: (.07)
BIDU: .86
CBI: 1.56
GPS: .57
HLF: .92
INTU: .04
KHC: .58
MELI: .67
MNST: .82
SPLK: (.54)
STMP: .79
Key Economic Reports
January durable goods released at 8:30am EST: +4.9% (actual) vs. +2.0% (estimate)
January durable goods ex-transports released at 8:30am EST: +1.8% (actual) vs. +0.0% (estimate)
Initial jobless claims released at 8:30am EST: 272,000 (actual) vs. 270,000 (estimate)
December FHFA house price index to be released at 9:00am EST: +0.5% (estimate)
Happy trading!
Tom


