Market Recap for February 24, 2016
Energy (XLE) and materials (XLB) tumbled on Tuesday as the U.S. dollar ($USD) continued its recent rally. The greenback rose just fractionally yesterday but it followed a very strong rally on Monday and closed above its 20 day EMA for a second consecutive session. Furthermore, a long-term bullish ascending triangle pattern has taken shape after the dollar's parabolic rise from July 2014 through March 2015. First, let's look at the short-term prospects of the dollar and what to watch for:
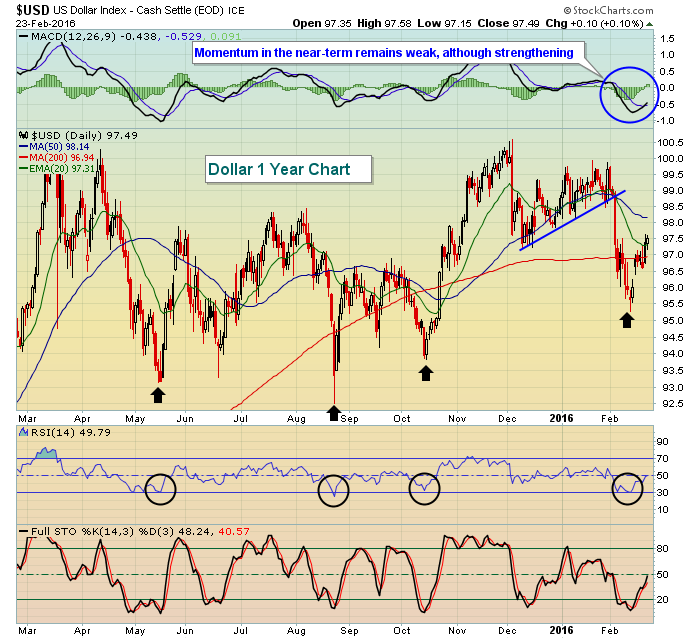 Momentum has favored the bears of late and that dollar weakness has helped to spur energy and materials to recent leadership. As you can see from the above, each time the dollar has reached oversold territory (RSI at 30 - black circles), the dollar has rallied strongly and that creates a massive headwind for energy and materials stocks. But the problem isn't short-term oversold conditions. The bigger problem for energy and materials stocks is the long-term bullish pattern as reflected below:
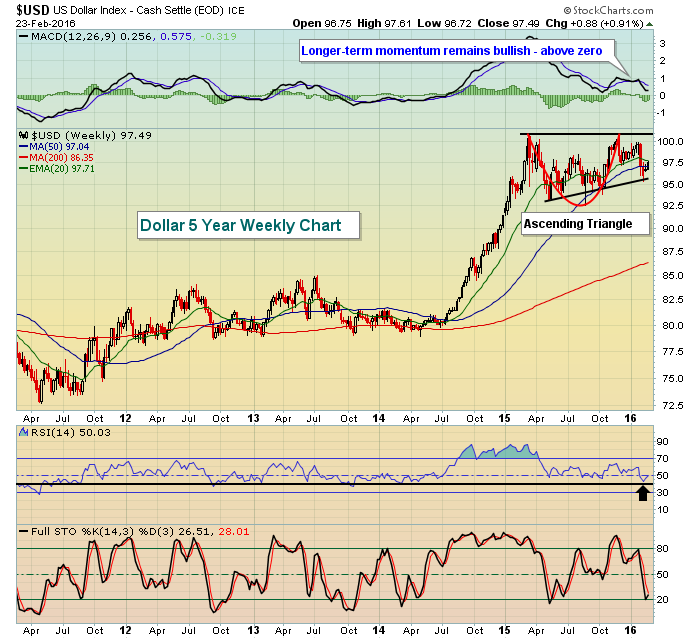 While oversold in a sideways consolidating market is at RSI 30 - as has been the case on the daily USD chart, in an uptrending chart like the one above, RSI 40 normally provides nice support and the black arrow above highlights this. The longer-term rise is quite evident on this big picture chart and the back and forth action on the daily chart represents a bullish continuation pattern on the weekly chart. It could be argued that the dollar is in a cup with handle pattern (red cup) or an ascending triangle pattern (black lines highlight equal price highs and rising price lows). Both of these patterns are very bullish. Should triangle support be lost, which is possible, the lows near 93.00 would still mark very bullish price support. I would only begin to grow more bearish on the dollar if that support is lost. Until then, I view the dollar as being in a bullish continuation phase - and that is not good news for energy and materials, especially for gold.
Leadership on Tuesday was found in utilities (XLU) and consumer staples (XLP) as traders once again turned to safety. I've questioned the latter stage of this current rally for a few reasons. One of those reasons has been the relative weakness of treasury yields, namely the 10 year treasury yield ($TNX), versus the S&P 500. There's been a form of a divergence where bond traders have been contradicting the strength in equities and I find that to be a red flag. For more on that, check out the Sector/Industry Watch section below.
Pre-Market Action
Tokyo's Nikkei Average ($NIKK) fell back below the 16000 level overnight following the struggles in the U.S. on Tuesday. The Hang Seng ($HSI) dropped more than 1%, but China's Shanghai Composite ($SSEC) bucked the selling trend, edging higher and setting up a possible test of price resistance near 3000. It has roughly another 2.50% to reach that recent reaction high.
In Europe, major markets are also weak and lower with Germany ($DAX) leading the selling. The DAX is down 2.41% (at last check) to 9189, beneath its 20 day EMA once again. That's not a great sign and because the DAX and S&P 500 are so positively correlated, there's a strong likelihood that the S&P 500 will also struggle to hang onto 20 day EMA support. In a bear market, price action below that key 20 day EMA must be respected.
Earnings out this morning have not been great, although TJX Companies (TJX) did beat its estimates, raise its dividend and announce a buy back. The problem technically, however, is that TJX has been struggling just above the 74 level and the pre-market price, though higher, still remains below that key resistance level.
Current Outlook
The long-term technical patterns suggest to me that we've been enjoying nothing more than an oversold, counter trend rally in equities that's been designed for failure from the beginning. Yesterday, we saw a bit of technical damage, but we'll begin to see more if rising 20 day EMAs are lost. Given the state of U.S. futures, that could very well be today unless trading sentiment changes intraday. Now that the S&P 500's positive divergence has resulted in an extended winning streak to test the 50 day SMA and reset its MACD near centerline resistance, we must be prepared for the potential of another wicked selloff. Let's look at the current technical state using a daily chart:
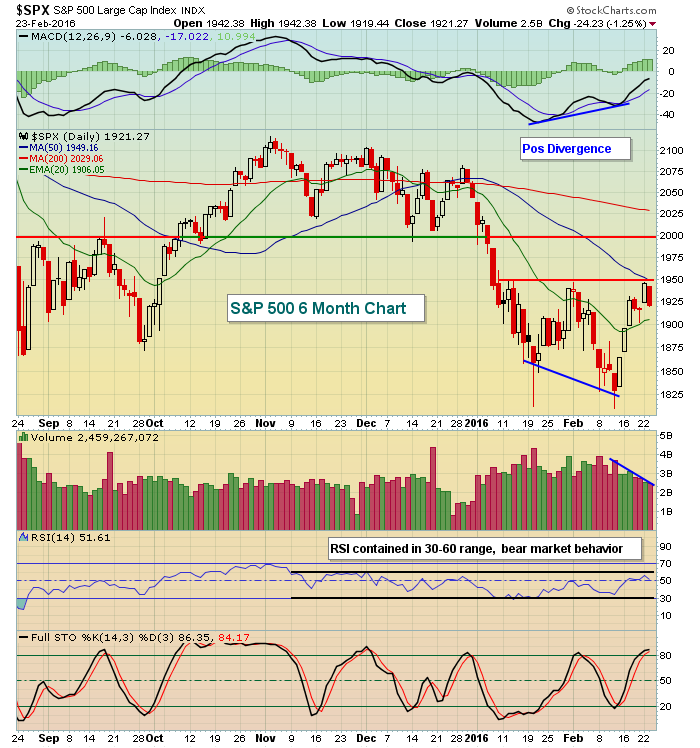 The positive divergence has played out as expected. But note that the RSI range for the past few months has favored bear market behavior (30 is oversold, but 60 is overbought). In bull markets, rallies tend to extend the RSI to 70, sometimes even higher. During bear markets, most rallies fail prior to reaching the 60 level. This is especially true on longer-term weekly charts.
If you're in the bullish camp, you'd like to see any weakness hold the rising 20 day EMA line just as it did last Friday. Loss of 20 day EMA support would be further confirmation that strength in February is nothing more than a counter trend rally within a longer-term downtrend.
Sector/Industry Watch
I like to evaluate the "sustainability" of a stock market rally by comparing the strength of the S&P 500 move to the strength of other key indices or relative ratios. One such index is the 10 year treasury yield index ($TNX). The rationale is that traders and investors have a choice to make every day. Do they want to commit their dollars to "growth" (think S&P 500) or "safety" (think treasuries)? Some firms allocate dollars between the two - say 75% equities and 25% treasuries. If treasuries are chosen as the investment of choice, treasury prices rise but treasury yields decline. Because treasuries are chosen over equities, the S&P 500 declines as well. So the relationship we should see is the S&P 500 rising along with the TNX. When the S&P 500 rises, but the TNX fails to move higher in lock step, it's a bit of a warning sign in that investors are not committed to the rally as money is flowing into treasuries (safety) as well. Recently, we've seen yet another perfect example of this. Check out this intraday chart and the relationship between these two:
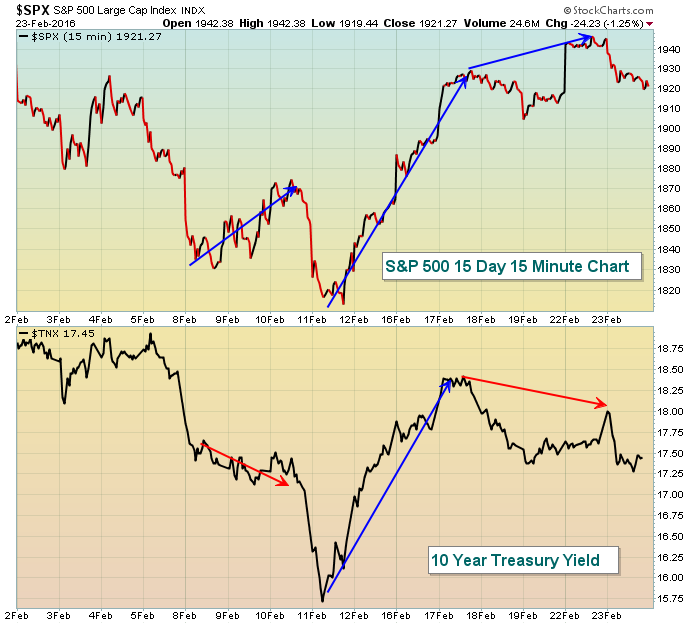 Just over the past two weeks you can see the red arrows where the TNX has not followed the S&P 500 higher - and both rallies in the S&P 500 proved unsustainable in the short-term. However, check out that recent four day rally from February 11th through February 17th. Both of these rallies ran together and unabated. That helps me to remain in a long position during what likely is a bear market. But when this relationship fails to hold, it's a must to be conservative and take profits. Remember: We are NOT trading by bull market rules any longer - at least I'm not until the market conditions improve and tell me otherwise.
Historical Tendencies
Yesterday, I provided March tendencies for both the S&P 500 and NASDAQ and suggested this calendar month favors the benchmark S&P 500. March also tends to be strong for small cap stocks (Russell 2000). In fact, we've begun the best consecutive four month period of the year for the Russell 2000. Here are the annualized returns for small caps from February through May since 1988:
February: +17.38%
March: +18.42%
April: 16.76%
May: +15.00%
History is bullish this time of year, but current technical conditions are not. When the two collide, I side with technical conditions. So I'm aware of seasonal strength, but I'm not counting on it.
Key Earnings Reports
(actual vs. estimate):
AES: .34 vs .33
HFC: .24 vs .31
LOW: .59 vs .59
RY: 1.22 vs 1.25
TGT: 1.52 vs 1.54
TJX: .99 vs .94
(reports after close, estimate provided):
CRM: .04
HPQ: .36
NTES: 1.92
VIPS: .17
Key Economic Reports
February PMI services to be released at 9:45am EST: 53.7 (estimate)
January new home sales to be released at 10:00am EST: 520,000 (estimate)
Happy trading!
Tom


