Special Note
Today marks my one year anniversary as Senior Technical Analyst here at StockCharts.com. I love being here and look forward to many more years with this truly great company. I want to thank everyone at StockCharts and also all of you for your support during the past year. I'm very appreciative and enjoy writing every day about the stock market, despite all the crazy ups and downs. If you haven't already, please take a moment and scroll to the bottom of my article today and subscribe to my blog. There's a question that reads "Would You Like To Receive Email Notifications Whenever A New Article Is Added To This Blog?". Click on "Yes", provide your email address and then click "Subscribe". From that point forward, as soon as I publish an article, it will be sent to your email. It's a great feature at StockCharts.com and applies to all the great blogs here! Thank you so much and happy trading!
Market Recap for Monday, February 29, 2016
U.S. equities sold off late on Monday to put a temporary halt to the recent winning streak and rally. All four major indices - Dow Jones, S&P 500, NASDAQ and Russell 2000 - finished the day above their rising 20 day EMAs and below their declining 50 day SMAs. Volume accelerated on selling, but those key short-term 20 day EMAs are holding as support thus far. So while bears might claim a big victory on Monday's afternoon reversal, the truth is that we continue to meander between those two moving averages and below primary price resistance. Chalk up the round to the bears, but it wasn't a knockout.
Banks ($DJUSBK) were again under pressure. Despite a solid positive divergence under the group, they've managed to close above their 20 day EMA just once since it printed and Monday's close was its second lowest in the past week. Keep an eye on closing price support at 270. Loss of that would likely lead to a swift retest of the February low close of 255. Here's the chart:
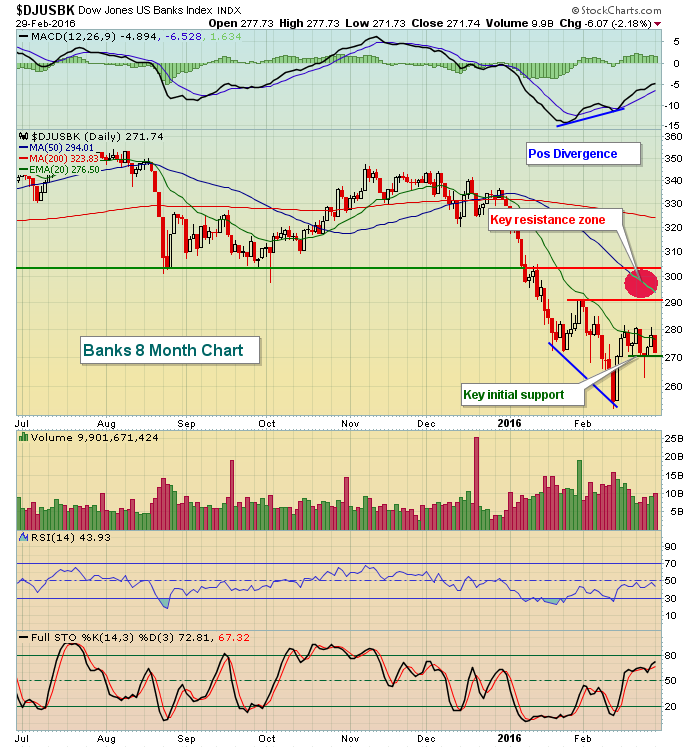 Volume on Monday surged to its highest level in the past eight trading sessions so loss of 270 price support on heavy volume should be respected and would not be a good sign for the direction of our major indices.
Elsewhere, biotechs ($DJUSBT) were very weak leading to underperformance in the healthcare (XLV) space. The XLV finished on the bottom of the relative leaderboard, losing 1.59% with the DJUSBT dropping 2.02%. Biotechs fell to their lowest close in two weeks and they don't have the benefit of slowing selling momentum (ie, no positive divergence). They appear to have made a turn for the worse Monday and technical conditions won't show any positives until the falling 20 day EMA is cleared. Volume surged on the short-term breakdown as well. Take a look:
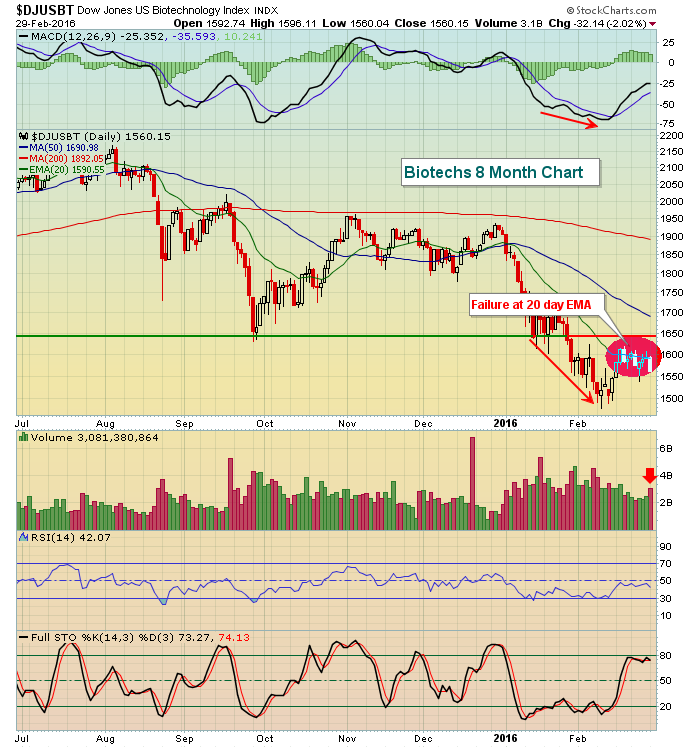 Recently, most areas of the U.S. stock market reflected higher MACD readings on its mid-February price lows, resulting in positive divergences that have led to the rally in the second half of February. The DJUSBT was an exception as the red directional lines highlight. The DJUSBT showed accelerating selling momentum on its earlier February low. As a result, its rally attempt failed at its declining 20 day EMA (red circle). The red arrow notes the increase in volume to accompany Monday's renewed selling and two week low close. Not good action. Price resistance is closer to 1650 so there's room for a more concerted buying effort should the overall market cooperate. Given the look of that MACD at its low price, however, we may need a retest of February lows or even a lower low (accompanied by a positive divergence) before the DJUSBT sees an extended rally to or near 1650.
Utilities (XLU) and consumer staples (XLP) led the market action on Monday, but both of these sectors are defensive in nature and both have technical issues of their own, especially the XLU. I've discussed these issues in the past couple blog articles so I won't go into it again here.
Pre-Market Action
U.S. futures have been strong overnight and are poised for solid open. Despite the afternoon selloff in the U.S., global markets have been impacted little and that perhaps is adding some confidence in early pre-market trading.
Asian markets were higher as China's Shanghai Composite ($SSEC) posted a 1.68% gain and Hong Kong's Hang Seng index ($HSI) rallied 1.55%. In Europe, the London FTSE ($FTSE), French CAC ($CAC) and German DAX ($DAX) are all higher as well, with a particularly strong 1.63% advance in the DAX at last check. Should the DAX finish at its current level (9650), it would be its highest close since February 1st. 9880-9960 is a very critical price and gap resistance level that the bulls would love to clear.
Current Outlook
Seasonality provides the bulls with tail winds the balance of this week. The start to nearly every calendar month typically has bullish seasonal implications as money flow tends to be quite strong. Still, there are plenty of technical obstacles ahead that will need to be successfully navigated. The price resistance zone on the S&P 500 from 1950-1995 is one area of resistance for sure. The NASDAQ tried for the second time to penetrate gap resistance at 4620 without success on Monday. In order for U.S. stocks to sustain their recent rally, gap resistance needs to be cleared. Here's an intraday illustration:
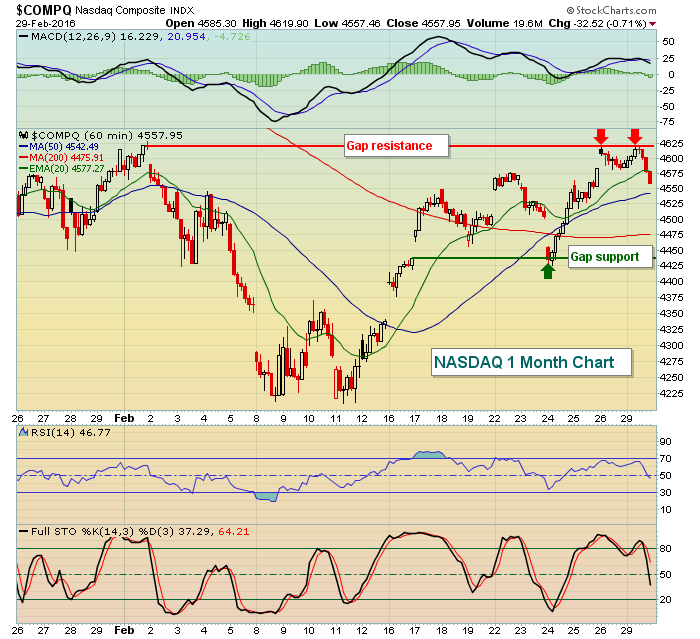 The short-term trading range would seem to be from gap support to gap resistance, or 4425-4620. The bulls hold the short-term advantage as the uptrend remains in play, but the bears are holding onto the bigger picture as key price resistance has not been penetrated on our major indices. I give the edge to the bears and another leg lower in the days and weeks ahead, but they'll need to withstand this current rally and the favorable seasonal pattern during the first week of March.
Sector/Industry Watch
Home construction ($DJUSHB) is an area to really focus on this week as Friday's nonfarm payrolls report approaches. Obviously, this group is interest rate sensitive and the report on Friday will likely have a significant impact on treasury yields. Technically, the DJUSHB has performed exactly as I would expect coming off of its recent positive divergence. The group has reset its daily MACD and tested its 50 day SMA from underneath. Where does it go from here? Get this one right and you'll likely have your directional answer for our major indices as well. Here's the latest on the DJUSHB:
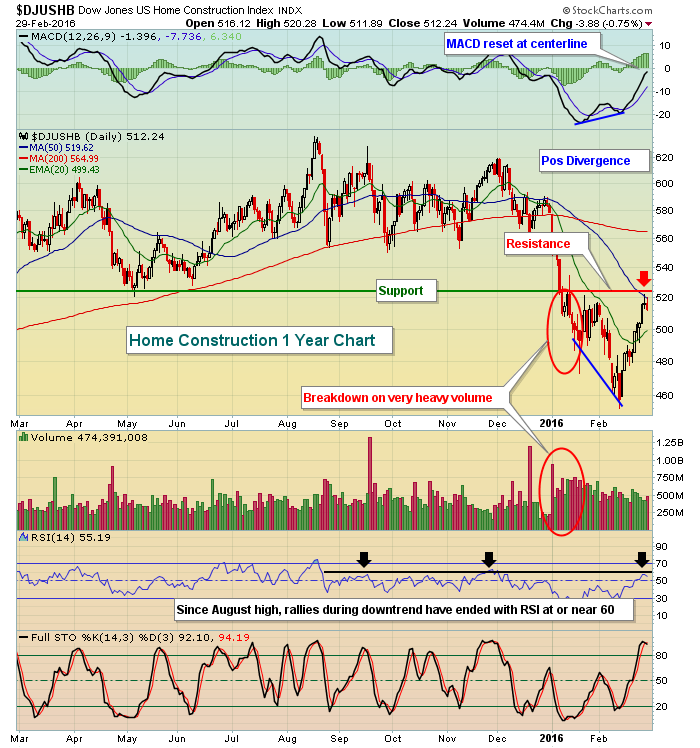 This chart is truly a perfect instructional chart on how technical analysis tools can be very useful in managing risk. The price breakdown in January beneath earlier lows in May occurred on very heavy volume, which must be respected. A bottom did not form until a positive divergence on the MACD printed, alerting us to slowing momentum. Prior to that divergence, the falling 20 day EMA provided excellent resistance for shorts. After the divergence, however, price action moved back above the declining 20 day EMA and the DJUSHB just reached its 50 day SMA and reset its MACD at the zero line. Home construction is now poised to move in either direction. We need to watch and see what clues the market gives us and with the jobs report due out on Friday, we'll likely soon know. Key resistance is now at 525 and the rising 20 day EMA should provide support if the group is truly trending higher.
Historical Tendencies
The Russell 2000 begins its second month (March) of a consecutive four month period (February through May) where it has produced double digit annualized returns since 1988. For March, the Russell 2000's annualized return is +18.42%, which trails only December in terms of best performing calendar month for small caps.
Key Earnings Reports
(actual vs. estimate):
AZO: 7.43 vs 7.27
BCS: .46 estimate (BCS reported a miss and dividend cut, but it's not clear how the EPS translates into U.S. $$$)
BNS: 1.08 vs 1.04
DLTR: 1.01 vs 1.04
MDT: 1.06 vs 1.06
(reports after close, estimate provided):
DAR: .05
ROST: .64
Key Economic Reports
February PMI manufacturing to be released at 9:45am EST: 51.3 (estimate)
February ISM manufacturing to be released at 10:00am EST: 48.5 (estimate)
January construction spending to be released at 10:00am EST: +0.5% (estimate)
Happy trading!
Tom


