Market Recap for February 1, 2016
Yesterday I posted a chart showing that both energy (XLE) and crude oil ($WTIC) were approaching key resistance and likely to retreat. Right on cue, the XLE was the worst performing sector yesterday, falling 1.67% despite a bifurcated market where our major indices were all close to the flat line. The good news is that while energy fell, there was enough strength elsewhere to maintain the status quo. The bad news is that energy fell because of tumbling crude oil prices once again and it's the falling crude that has global markets so nervous. Here's the chart:
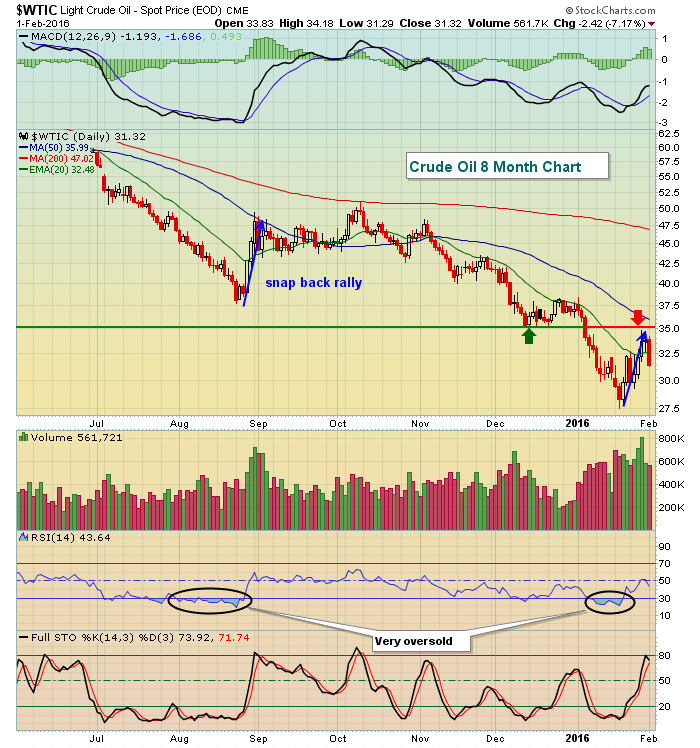 The 7% drop in crude oil on Monday was the culprit for weakness in the XLE and crude oil now finds itself in a 27.50-35.00 trading range. Unfortunately, oil is down another 3% at last check this morning. That isn't going to help our major indices.
Pipelines ($DJUSPL) led the energy decline on Monday with a 3.58% tumble. This group recently printed a positive divergence and, as a result, had moved back above its 20 day EMA for the first time in the past few months. The red arrows below mark key resistance at the declining 20 day EMA, but after that positive divergence emerged, the DJUSPL climbed back above its 20 day EMA (blue circle). Check it out:
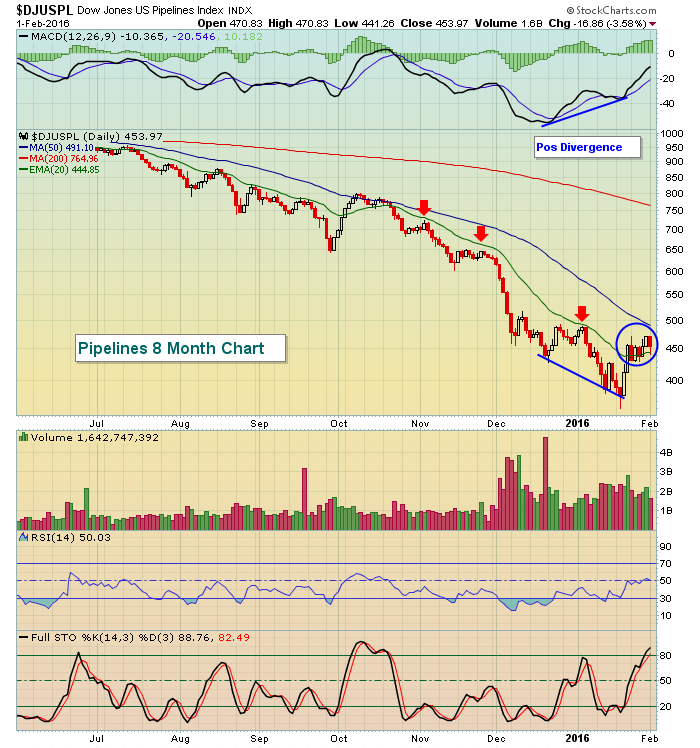 The now-rising 20 day EMA becomes the first critical support for the DJUSPL and you can see that we bounced off that moving average during yesterday's trading. Failure to hold that support will likely lead to a retest of recent lows.
Once again, strength came in the form of the defensive utilities (XLU) on Monday. Money simply refuses to support riskier stocks and that suggests this two week rally is on very tired and wobbly legs. There was one positive as the transportation index ($TRAN) cleared its falling 20 day EMA for the first time since December 1st. Airlines ($DJUSAR), railroads ($DJUSRR) and truckers ($DJUSTK) all had gains that outperformed the S&P 500 and we haven't seen much of that the past couple months. But even that strength was overshadowed by an even stronger utility group as relative strength in utilities continues.
Pre-Market Action
Alphabet (GOOGL) posted solid results and the stock is trading higher by more than 5%. Let me give you a warning on GOOGL though. Today's potential breakout will occur with a VERY poor weekly MACD. If I owned GOOGL (which I do not), I would raise my closing stop to 800. If price support fails to hold with a negative divergence on the weekly chart, I do not want to own - period. Take a look at the visual:
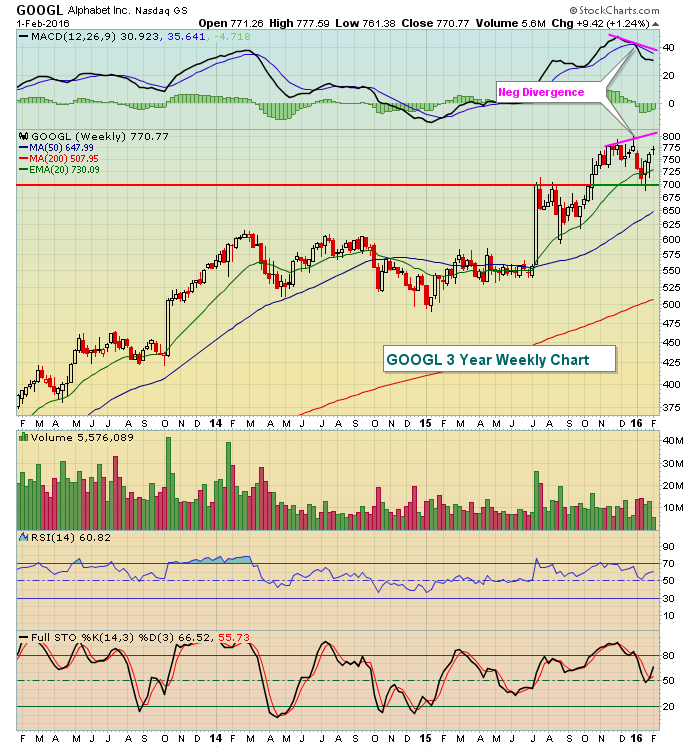 The breakout above 800 will likely be accompanied by heavy post-earnings volume and a high volume breakout trumps all other indicators. So while selling at the open might not be a bad idea, I believe GOOGL remains technically sound as prices could continue to push higher, eventually eliminating that negative divergence. But if price fails with a negative divergence in play, I'd be a seller as GOOGL would most likely be heading lower to test recent price lows closer to 700 and the rising 50 week SMA, currently at 648. That's why I'd watch the 800 level (actually 794) carefully.
Futures are lower this morning, mostly a reaction to the drop in crude oil prices as energy bulls will once again feel the pressure at the opening bell. Asian markets were mixed overnight while Europe trades mostly lower. There is little economic data due out today so all eyes will likely be on the reaction to earnings reports like GOOGL, UPS and others, and the direction of crude oil prices.
Current Outlook
Let's talk "January Effect". This is a historical indication of where the S&P 500 is likely heading the balance of the calendar year based on what transpired during the month of January. With all January precincts reporting (month has closed), the January loss stood at 5.07%. Out of 66 years since 1950, this places January 2016 in 59th place among those 66 January's.
I have done a study where I break January performance into four quartiles. The upper quartile (25%) of January's in terms of monthly performance ranges from +13.18% (January 1987) to +4.10% (January 1999). The average January gain for the upper quartile is 6.81%. The average "balance of the year" gain for those top January's is +17.51%. That's an impressive number considering that the S&P 500 had such great numbers in January. The stock market went on to provide huge gains during the balance of the year - not including those stellar January results!
Let me give you the breakdown of the four quartiles of average January performance, followed by average balance of year returns:
Top quartile: +6.81%; +17.51%
Second quartile: +2.81%; +9.75%
Third quartile: -0.72%; +1.27%
Fourth quartile: -5.21%; +2.26%
The above information suggests clearly that strong January performance tends to lead to strong balance of year performance, while weak January performance leaves little hope for the balance of the year.
January 2016 fell 5.07%, placing it squarely in that bottom quartile. The fourth quartile of January performance is comprised of the worst 16 January's since 1950. In those 16 years, we have seen double digit gains over the balance of the year 4 times. To compare, however, consider that in the upper quartile of the best 17 January's since 1950, we have seen double digit gains over the balance of the year 14 times with two other years returning 9% and 7%. There was only one year (1987 crash) where we saw an upper quartile January followed by a balance of the year decline.
Sector/Industry Watch
Due at least in part to a tumbling home construction index ($DJUSHB), the Dow Jones U.S. Real Estate Services index ($DJUSES) has been the worst performing industry group within the financial sector over the past three months. The group is very oversold and nearing key support where a bounce should be expected. Here's a look at the weekly chart:
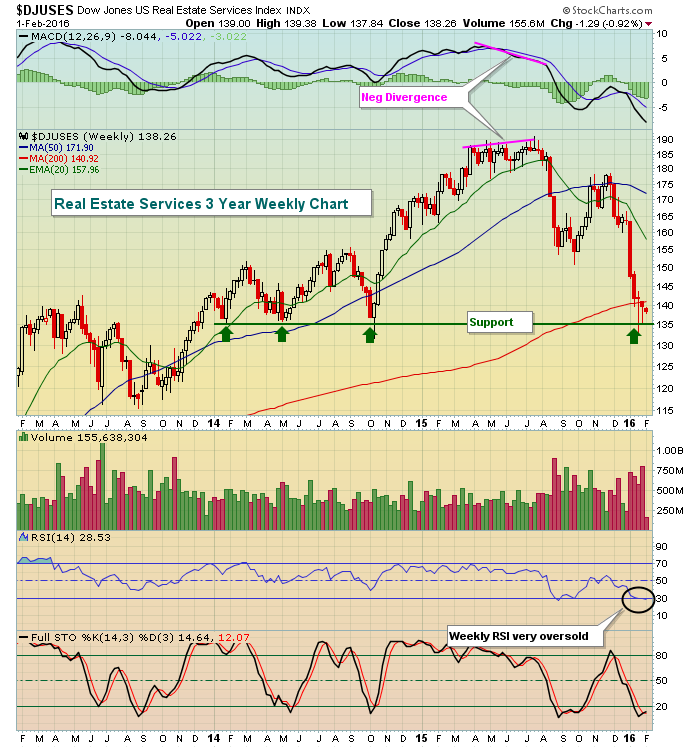 Clearly, volume trends here are very weak so if price support in the low- to mid-130s is lost, the breakdown must be respected. But a bounce definitely should not be ruled out, even if only temporary. The DJUSES was at its high in July, just prior to the August meltdown. Check out that nasty negative divergence though. Weekly negative divergences really grab my attention and you can see why as major price weakness followed. It's simply not worth the risk of holding on the long side when long-term momentum slows on the buy side.
Historical Tendencies
The S&P 500 will continue to benefit from historical tailwinds as February 2nd (today) and 3rd (tomorrow) have produced annualized gains of +47.30% and +48.86%, respectively, since 1950.
Key Earnings Reports
(actual vs. estimate):
BAX: .43 vs .31
BP: .06 vs .17
DOW: .93 vs .69
HRS: 1.49 vs 1.36
KORS: 1.59 vs 1.46
PBI: .48 vs .54
PFE: .53 vs .52
RCL: .94 vs .92
SIRI: .03 vs .03
UPS: 1.57 vs 1.41
XOM: .67 vs .65
(reports after close, estimate provided):
CMG: 1.85
GILD: 2.91
IACI: .78
ILMN: .82
UNM: .92
YHOO: .05
Key Economic Reports
None
Happy trading!
Tom


