Market Recap for Tuesday, March 1, 2016
Tuesday was a very impressive broad-based rally with index leadership from the NASDAQ, especially NASDAQ 100 shares, and also leadership from the key financial (XLF), technology (XLK) and consumer discretionary (XLY) sectors. Among industry groups, banks ($DJUSBK), computer hardware ($DJUSCR), software ($DJUSSW), internet ($DJUSNS), gambling ($DJUSCA) and broadline retailers ($DJUSRB) all performed exceptionally well as there was an absolute risk-on mentality throughout the session. Clearly, initial tests of price resistance and key moving averages like the 50 day SMA were no match for buyers on this first day of March. The bulls should be set to run prices higher in the near-term until more critical price resistance levels are challenged.
As an example, let's look at the DJUSCR, which cleared its 50 day SMA and rose 3.58% on Tuesday on the back of Apple's (AAPL) nearly 4% gain:
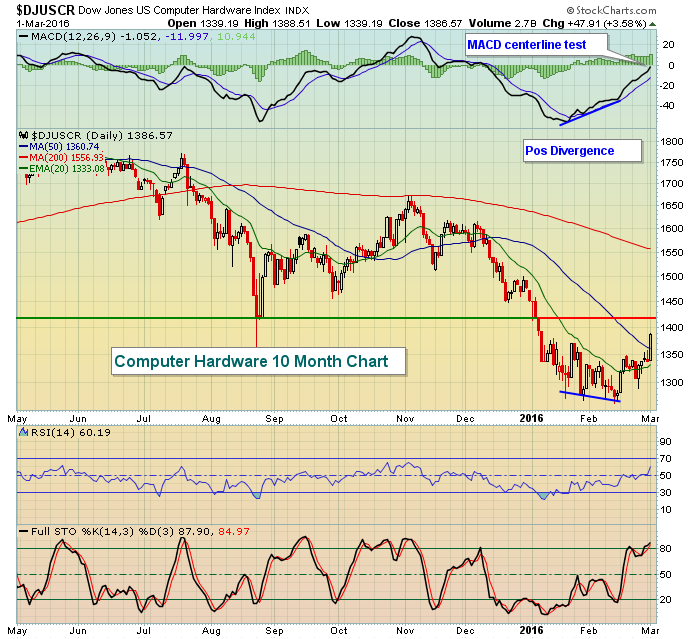 RSI has reached 60 and the stochastic is nearly 90. Those are very overbought readings in a bear market. So the obvious question is.....are we in a bear market? I say yes, although we saw traders in risk-on mode on Tuesday and that has happened very little the past few months. If you believe we are resuming the seven year bull market, you'll want to see money continue to flow to aggressive areas as it did today.
Pre-Market Action
Crude oil ($WTIC) trades slightly lower this morning and that's leading U.S. futures to the downside as well. Like so many areas of the market, we've seen WTIC rebound nicely. The problem, however, is that it's now up against very significant resistance near $35 per barrel. Check out the chart:
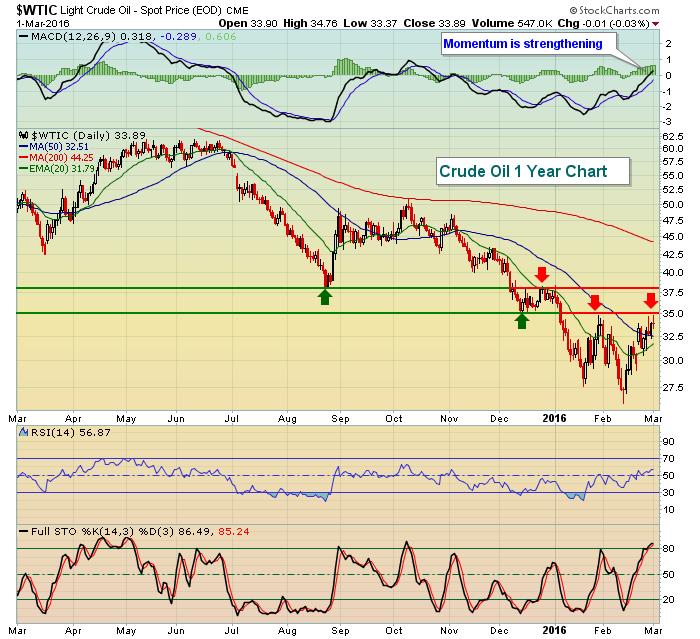 Crude oil has returned to an important resistance level and the market will likely take its cue from energy (XLE) so keep an eye on this space. Asian markets were mostly higher by 3%-4%, but we're seeing little follow through in Europe thus far this morning. A key technical test was taking place in Germany as the DAX is up fractionally and testing its 50 day SMA for the first time in 2016. Many times the S&P 500 follows the DAX so it would be prudent to watch action in Germany through to its close today.
Current Outlook
Clearing critical short-term resistance levels sets the market up for further gains in the near-term. The S&P 500 has key price resistance at 1995 so be cautious if we see intraday moves above that level and there's failure to hold into the close. That could mark a very significant top, especially given the current Volatility index ($VIX) reading.
Two charts to watch for further directional clues in the S&P 500 are the VIX and the 10 year treasury yield ($TNX). Take a look at both below:
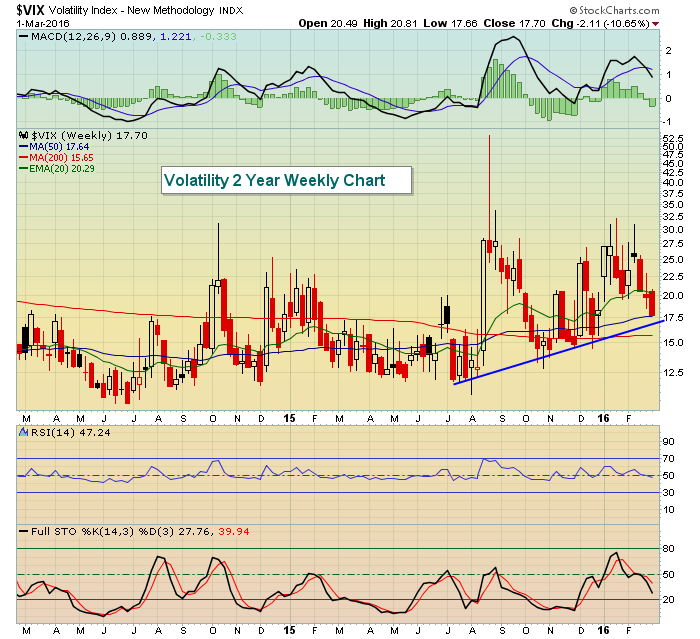 An uptrending VIX is synonymous with a downtrending S&P 500. The uptrend is clear - for now. We also know that during bear markets, key price resistance levels are reached on the S&P 500 when the VIX dips down close to 17. Tuesday's close was 17.70 after being above 30 recently. Next, check out the key resistance on the TNX:
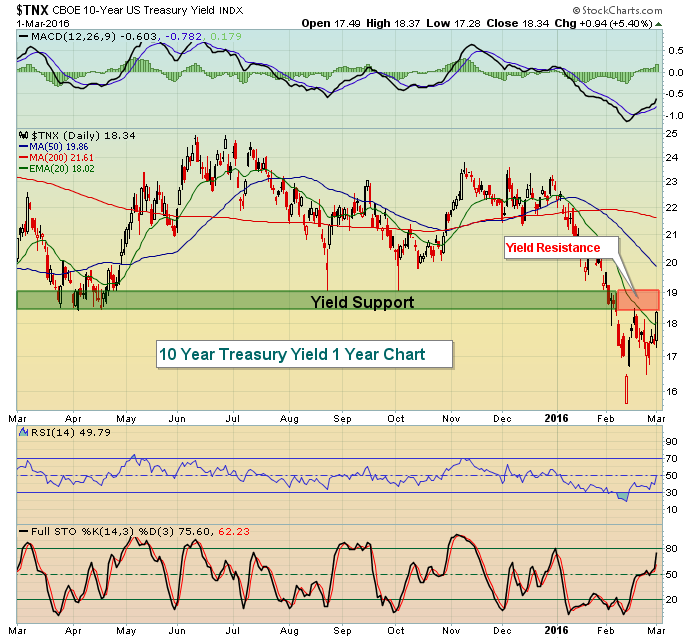 Should the VIX move below 17 and the TNX break above 1.90%, the odds increase of an S&P 500 rally above 2000. A failure to break 17 support on the VIX and 1.90% resistance on the TNX would set the market up much more bearishly, in my opinion.
Sector/Industry Watch
There didn't seem to be much question about whether we were in a bear market two weeks ago. And I'm still not questioning it. It's not unusual to have strong countertrend rallies, especially after a positive divergence prints. I indicated then that this rally would likely be longer than other rallies and I pointed to key price resistance levels that could be reached. We're now approaching those levels and at times this might seem like nothing more than a gamble. So why not take a look at the Dow Jones U.S. Gambling Index ($DJUSCA)? Well, here's the update and there's definitely improvement in the works:
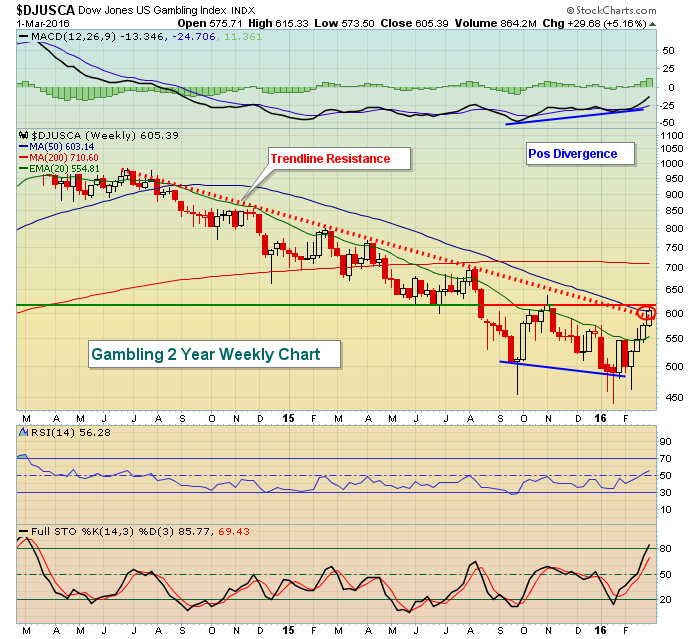 The DJUSCA has tried to bottom on a few occasions over the past year, but this is about as good as this group has looked in the past couple years. The recent strength is coming off a strong positive divergence. We've now seen a MACD reset and 50 week SMA test. Further strength and a breakout above the key resistance highlighted with the red circle would be very bullish for this group.
Historical Tendencies
The bullish early March historical period was jumpstarted with massive gains on Tuesday, March 1st. Over the past 65 years on the S&P 500, the 1st day of ALL calendar months has produced annualized returns of +46.63%, making the first calendar day the best day of the month. The second calendar day of the month also produces very strong annualized results, gaining on average +38.35%. A rather striking statistic is that these two calendar days have been responsible for nearly 20% of all S&P 500 gains since 1950. That's right, 2 days out of 31 have accounted for nearly 20% of all the S&P 500 gains over 65 years. Pretty amazing stuff.
Key Earnings Reports
(actual vs. estimate):
ANF: 1.08 vs .96
(reports after close, estimate provided):
AEO: .41
COST: 1.28
Key Economic Reports
February ADP employment report released at 8:15am EST: 214,000 (actual) vs. 185,000 (estimate)
Happy trading!
Tom


